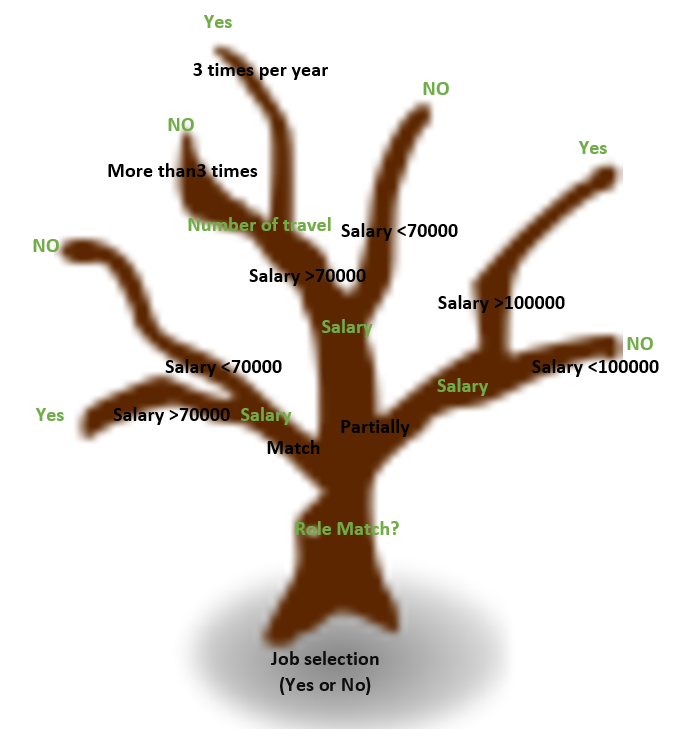
Decision Tree: Power BI- Part 2
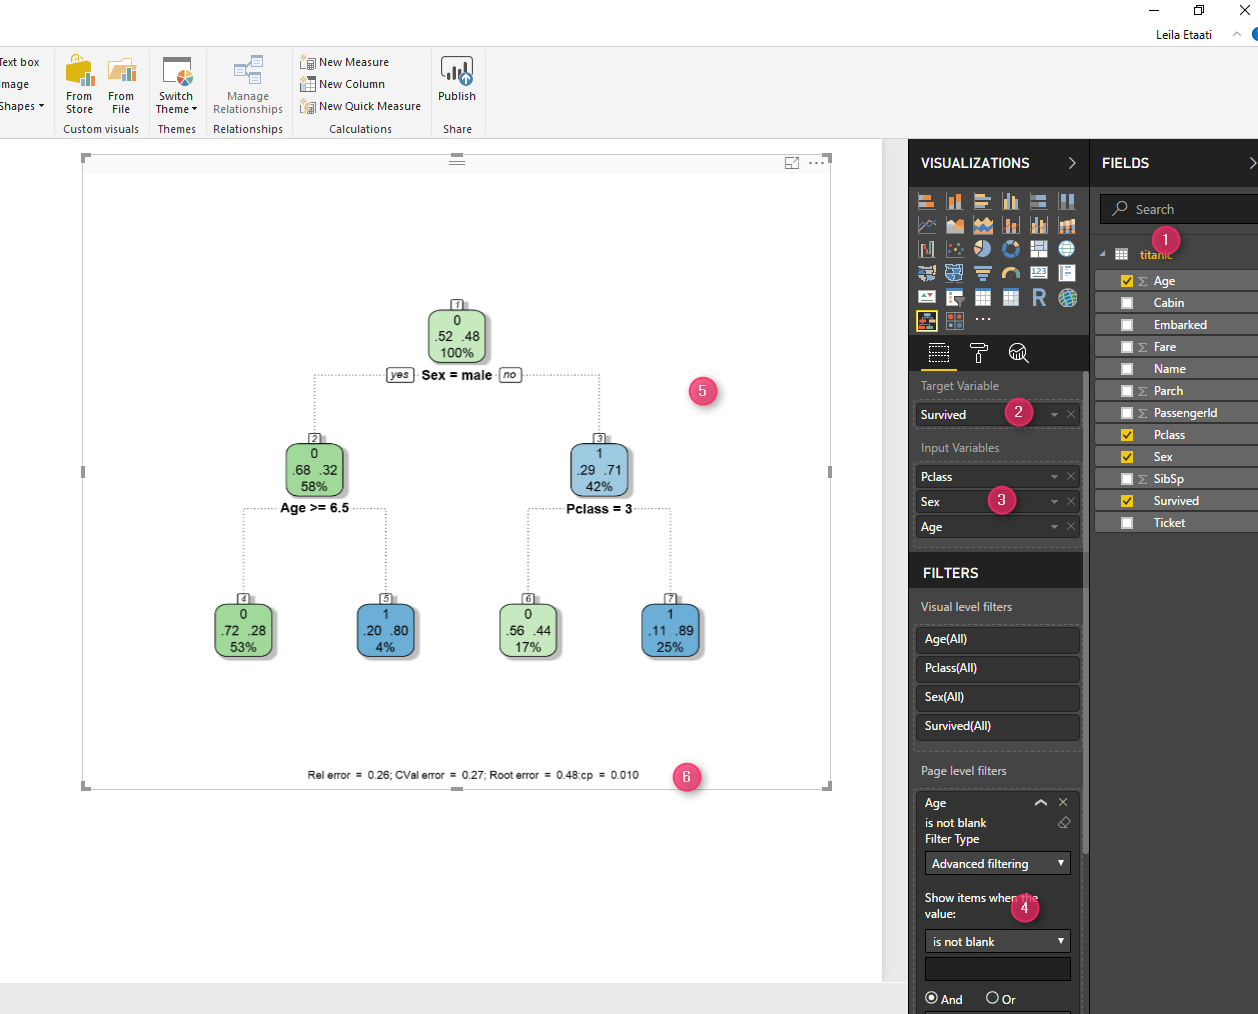
In the last Part, I have talked about the main concepts behind the Decision Tree. In this post, I will show how to use decision tree component in Power BI with the aim of Predictive analysis in the report. in next post, I will explain how to fetch the data in Power Query to get a dynamic Read more about Decision Tree: Power BI- Part 2[…]