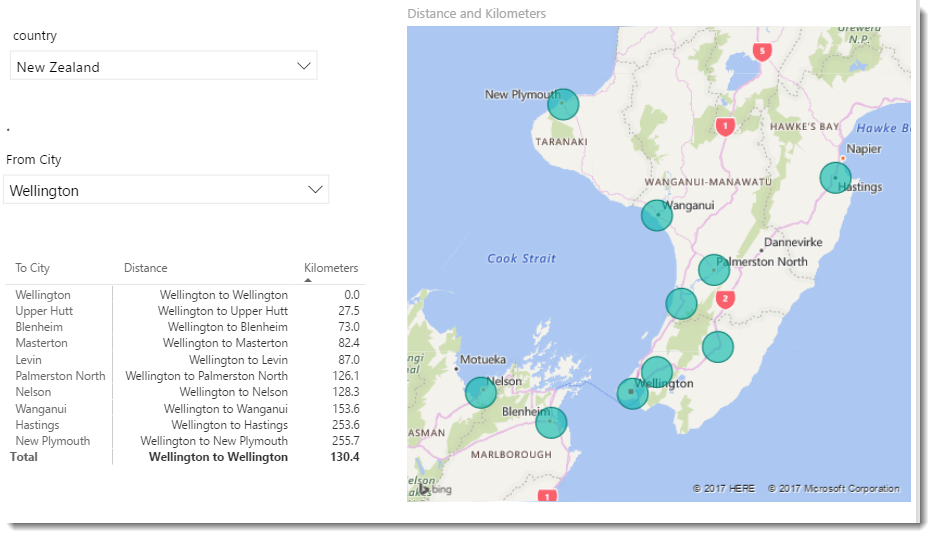
ArcGIS Map in Power BI; Simple, But Insightful

I have written about 4 other types of map visual with Power BI before. In this post I want to explain how ArcGIS visual work as a map visual. There are some specific features in this visual which is simple to use, but will give you a lot of insight. With this type of map Read more about ArcGIS Map in Power BI; Simple, But Insightful[…]

One Data Set, Multiple Reports; Power BI Next Big Step Forward

You can use an existing data set with LiveQuery or DirectQuery connection as the shared data source for multiple Power BI reports. You can also create multiple reports from Power BI Service (website) connecting to the same data set. However, this new feature in Power BI Desktop version April 2017 is a big step forward; Read more about One Data Set, Multiple Reports; Power BI Next Big Step Forward[…]

Have more Charts by writing R codes inside Power BI: Part 3

In the previous parts (Part 1 and Part 2) , I have shown how to draw a chart in the power BI (Part 1) visualization. Also, in Part 2 I have shown how to present 5 different variables in just one single chart. In this post, I will show how to shows some sub plots in a Read more about Have more Charts by writing R codes inside Power BI: Part 3[…]

Have more Charts by writing R codes inside Power BI: Part 2

In the previous post (Part 1) I have explained how to write a simple scatter chart in the Power BI. Now in this post I am going to show how to present 5 different values in just one chart via writing R scripts. I will continue the codes that I wrote in the previous post  as below : Read more about Have more Charts by writing R codes inside Power BI: Part 2[…]

Have more Charts by writing R codes inside Power BI: Part 1

Power BI recently able users to embedded the R graphs in Power BI. There are some R visuals that it would be very nice to have them in Power BI. What is R ? Based on Wikipedia,  R is an open source programming language and software environment for statistical computing and graphics that is supported Read more about Have more Charts by writing R codes inside Power BI: Part 1[…]

Edition 2 of Free Book: Power BI from Rookie to Rock Star

As promised, here is the second edition (March 2017) of Power BI book; from Rookie to Rock Star as PDF. We are still working on other methods of sharing this book (Kindle, paperback…). In this new version March’s posts are added which are; M or DAX? Content Packs, Shape Map, and IF or Filter in Read more about Edition 2 of Free Book: Power BI from Rookie to Rock Star[…]

Prediction via KNN (K Nearest Neighbours) KNN Power BI: Part 3

K Nearest Neighbour (KNN ) is one of those algorithms that are very easy to understand and it has a good level of accuracy in practice. In Part One of this series, I have explained the KNN concepts. In Part 2 I have explained the R code for KNN, how to write R code and how Read more about Prediction via KNN (K Nearest Neighbours) KNN Power BI: Part 3[…]

Prediction via KNN (K Nearest Neighbours) R codes: Part 2

In the previous post (Part 1), I have explained the concepts of KNN and how it works. In this post, I will explain how to use KNN for predict whether a patient with Cancer will be Benign or Malignant. This example is get from Brett book[1]. Imagine that we have a dataset on laboratory results of some patients Read more about Prediction via KNN (K Nearest Neighbours) R codes: Part 2[…]

Make Business Decisions: Market Basket Analysis Part 2

In the Part one I have explained the main concepts of Market basket analysis (associative Rules) and how to write the code in R studio. In this post I will explained the process of doing market basket analysis in Power BI. for doing this post I have used the data set from [1]. Power BI Desktop, is Read more about Make Business Decisions: Market Basket Analysis Part 2[…]

IF and Filter are Different! Be Careful (DAX)

DAX has many functions to write conditional expressions. For example you might want to calculate sum of sales amount for all “Red” products. you can achieve it by using SUMX or Calculate, and functions such as IF or Filter to write a conditional expression for product color to be equal to “Red”. At the first Read more about IF and Filter are Different! Be Careful (DAX)[…]