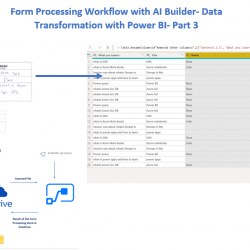
Form Processing Workflow with AI Builder- Data Transformation with Power BI- Part 3
In the last two posts, I have explained how to use AI Builder with Microsoft Automate (Flow), to do the form processing. In the first post, how to set up AI Builder has been explained, next in the second one how to use Power Automate to detect the fields in a form has been shown. Read more about Form Processing Workflow with AI Builder- Data Transformation with Power BI- Part 3[…]