Neural Network R codes in Power BI Part2

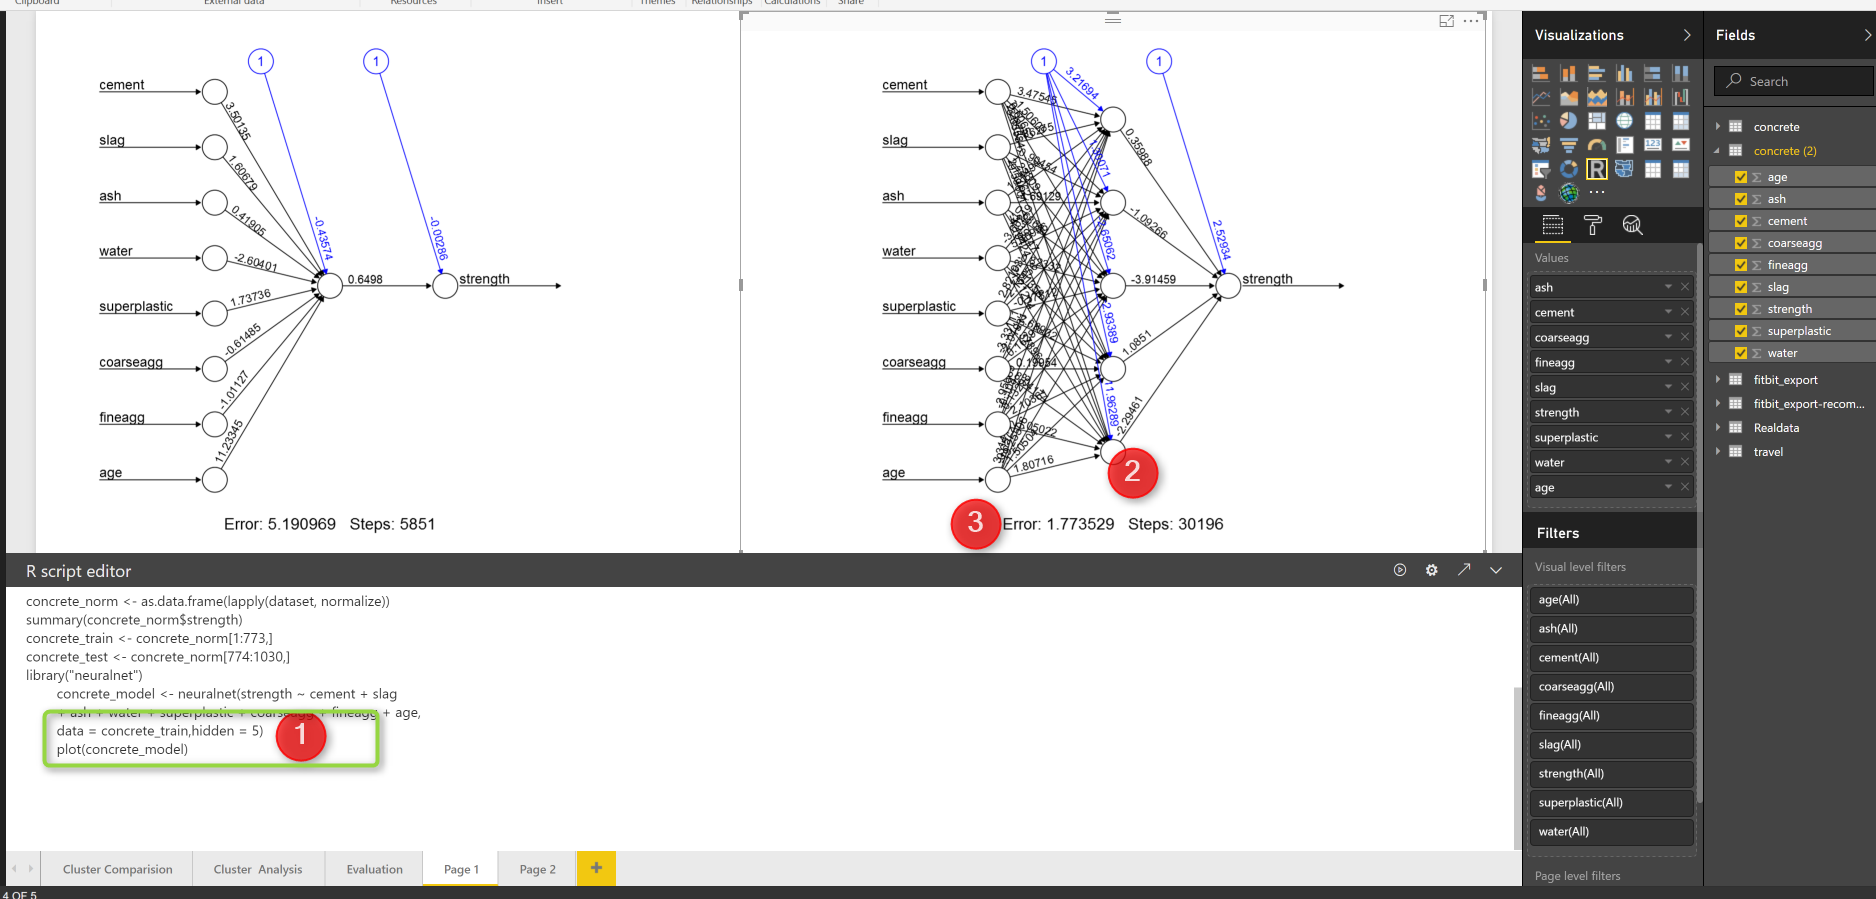
In the last post, I have explained the main concepts behind the neural network, In this post I will show how to apply neural network in a scenario in R and how to see the results and hidden layers in a plot. For this post I got some great example from [1]. Scenario: Concert has Read more about Neural Network R codes in Power BI Part2[…]

Visualizing Data Distribution in Power BI – Histogram and Norm Curve -Part 2

In the Part 1 I have explained some of the main statistics measure such as Minimum, Maximum, Median, Mean, First Quantile, and Third Quantile. Also, I have show how to draw them in Power BI, using R codes. (we have Boxplot as a custom visual in power BI see :https://powerbi.microsoft.com/en-us/blog/visual-awesomeness-unlocked-box-and-whisker-plots/ ). However, to see the data Read more about Visualizing Data Distribution in Power BI – Histogram and Norm Curve -Part 2[…]

K-mean clustering In R, writing R codes inside Power BI: Part 6

In the previous post,I have explained the main concepts and process behind the K-mean clustering algorithm. Now I am going to use this algorithm for classifying my Fitbit data in power BI.   as I have explained in part 5, I gathered theses data from Fitbit application and I am going to cluster them using Read more about K-mean clustering In R, writing R codes inside Power BI: Part 6[…]

Variable Width Column  Chart, writing R codes inside Power BI: Part 4

In the part 1, I have explained how to use R visualization inside Power BI. In the second part the process of visualization of five dimension in a single chart has been presented in Part 2, and finally in the part 3 the map visualization with embedded chart has been presented. In current post and next ones I Read more about Variable Width Column  Chart, writing R codes inside Power BI: Part 4[…]

Have more Charts by writing R codes inside Power BI: Part 3

In the previous parts (Part 1 and Part 2) , I have shown how to draw a chart in the power BI (Part 1) visualization. Also, in Part 2 I have shown how to present 5 different variables in just one single chart. In this post, I will show how to shows some sub plots in a Read more about Have more Charts by writing R codes inside Power BI: Part 3[…]

Have more Charts by writing R codes inside Power BI: Part 2

In the previous post (Part 1) I have explained how to write a simple scatter chart in the Power BI. Now in this post I am going to show how to present 5 different values in just one chart via writing R scripts. I will continue the codes that I wrote in the previous post  as below : Read more about Have more Charts by writing R codes inside Power BI: Part 2[…]

Have more Charts by writing R codes inside Power BI: Part 1

Power BI recently able users to embedded the R graphs in Power BI. There are some R visuals that it would be very nice to have them in Power BI. What is R ? Based on Wikipedia,  R is an open source programming language and software environment for statistical computing and graphics that is supported Read more about Have more Charts by writing R codes inside Power BI: Part 1[…]

Prediction via KNN (K Nearest Neighbours) KNN Power BI: Part 3

K Nearest Neighbour (KNN ) is one of those algorithms that are very easy to understand and it has a good level of accuracy in practice. In Part One of this series, I have explained the KNN concepts. In Part 2 I have explained the R code for KNN, how to write R code and how Read more about Prediction via KNN (K Nearest Neighbours) KNN Power BI: Part 3[…]

Script Component as Source – SSIS

There are many situations which you can use power of scripting in SSIS data flow. Today I encounter a situation here , there is source flat file here with header and trailer records which have different structure from data rows. Data rows delimited by vertical line ( | ) , but header and trailer not. Read more about Script Component as Source – SSIS[…]

Retrieve Part of XML File

Today I faced a question on changing style of an xml file and fetch desired result as another xml file,  The XML file has lots of un-necessary tags which should be removed , I tried to do this with C#.NET code. This is the input xml: <?xml version="1.0" encoding="utf-16"?><DataTable>  <xs:schema id="NewDataSet" xmlns="" xmlns:xs="http://www.w3.org/2001/XMLSchema" xmlns:msdata="urn:schemas-microsoft-com:xml-msdata">    <xs:element Read more about Retrieve Part of XML File[…]