Microsoft Business Applications Summit – 2018 Keynote (Live Blog)

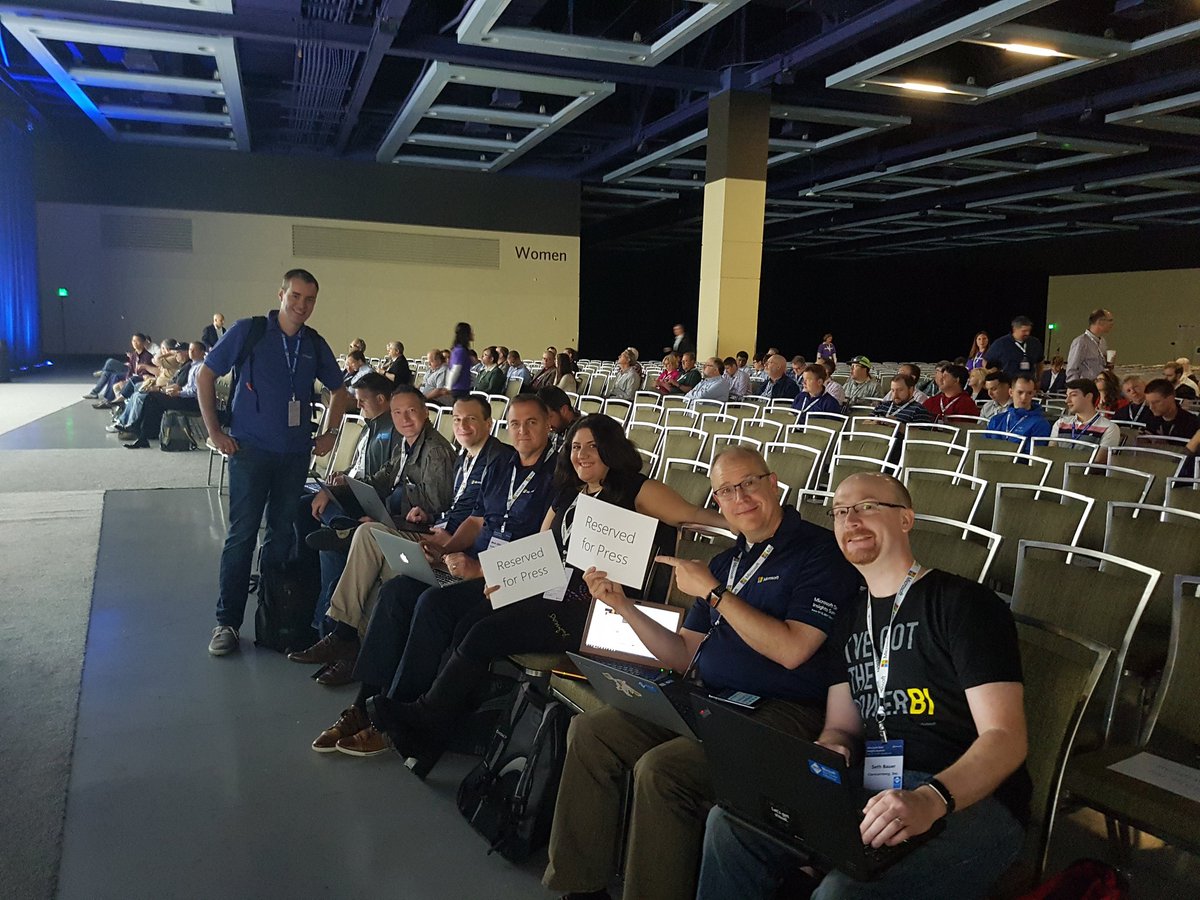
I have front row seats at the keynote that will begin shortly.  As features and announcements are made, I will update here. The room is massive and filling fast.  I’m sitting with some true legends in right by the stage and there is an electric buzz in the air. And we are underway. Power BI Read more about Microsoft Business Applications Summit – 2018 Keynote (Live Blog)[…]

Dynamic Date Range from Slicer

A recent post on a community.powerbi.com forum asked if it was possible to show a slicer of months, and configure a report so when a user selects a single month from the slicer, visuals will show data for a date range relative to that selection e.g. the preceding  10 months of data. If a user Read more about Dynamic Date Range from Slicer[…]

Integrate Power BI Into Your Application: Part 6 – Real-time Streaming and Push Data

It’s been a while since the last post about Power BI REST API. I have written previously about how to get the REST API, and use it in your application, how the authentication works, and things such as embedding content, and data source management. In this post, I’m going to explain one of the functionalities Read more about Integrate Power BI Into Your Application: Part 6 – Real-time Streaming and Push Data[…]

2017 Data Insights Summit – Key Note (Live)

Not just one but TWO live blogs from Radacad running so you won’t miss anything! Reza is also blogging here https://radacad.com/microsoft-data-insight-summit-2017-keynote-live-blog 5 mins to go. Sitting between Chris and Alberto. We are delayed due to the massive influx of attendees queuing to get in. James Phillips speaking now Summit sold out 5 weeks early 2500 Read more about 2017 Data Insights Summit – Key Note (Live)[…]

Optimising Power BI data models

For this blog I thought I would share a handy trick for optimising Power BI using a data modelling solution that is often forgotten or overlooked.  It involves focusing on certain columns based on the degree of uniqueness they contain and converting or removing all together from a data model.  I will explain how and why this Read more about Optimising Power BI data models[…]

Azure ML Part 4: A Machine Learning Prediction scenario (1)

In previous Posts Part 1, Part 2 and Part3  I have explain some about the azure Ml environment, how to import data into it and finally how to do data transformation using Azure ML component. In this post and the next one I am going to show how to do a Machine Learning in Azure Read more about Azure ML Part 4: A Machine Learning Prediction scenario (1)[…]

Visualizing Data Distribution in Power BI – Histogram and Norm Curve -Part 2

In the Part 1 I have explained some of the main statistics measure such as Minimum, Maximum, Median, Mean, First Quantile, and Third Quantile. Also, I have show how to draw them in Power BI, using R codes. (we have Boxplot as a custom visual in power BI see :https://powerbi.microsoft.com/en-us/blog/visual-awesomeness-unlocked-box-and-whisker-plots/ ). However, to see the data Read more about Visualizing Data Distribution in Power BI – Histogram and Norm Curve -Part 2[…]

Visualizing numeric variables in Power BI – boxplots -Part 1

In this post and next one, I am going to show how to see data distribution using some visuals like histogram, boxplot and normal distribution chart. It always important to have a holistic perspective regarding the minimum, maximum, middle, outliers of our data in one picture. One of the chart that helps us to have a Read more about Visualizing numeric variables in Power BI – boxplots -Part 1[…]

Identifying Number of Cluster in K-mean Algorithm in Power BI: Part 7

I have explained the main concept behind the Clustering algorithm in Post 5 and also I have explained how to do cluster analysis in Power BI in Part 6. In this post, I will explain how identify the best number of cluster for doing cluster analysis by looking on the “elbow chart” K-Mean clusters the data Read more about Identifying Number of Cluster in K-mean Algorithm in Power BI: Part 7[…]

K-mean clustering In R, writing R codes inside Power BI: Part 6

In the previous post,I have explained the main concepts and process behind the K-mean clustering algorithm. Now I am going to use this algorithm for classifying my Fitbit data in power BI.   as I have explained in part 5, I gathered theses data from Fitbit application and I am going to cluster them using Read more about K-mean clustering In R, writing R codes inside Power BI: Part 6[…]