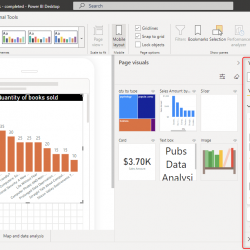
New Card Visual: Add Images to the Card Visual

One of the interesting features of the New Card visual is the capability to add images to the Card visual.It added more context to the car visual. In this blog post, I will show some data related to cancer in New Zealand based on gender and cancer type. Now I made two changes first if Read more about New Card Visual: Add Images to the Card Visual[…]

Set Power BI Data Color: All Visuals to Follow Same Color for the Same Data Point

You can set the color in every visual in Power BI easily. You can also set the color of multiple visuals at the same time using Themes. However, what if you want to set the same color for the same data point? For example, You want the Gender Female to be always colored Orange in Read more about Set Power BI Data Color: All Visuals to Follow Same Color for the Same Data Point[…]

TOP N Filter in Power BI with Zero DAX Code; Visual Level Filter

I have previously written articles about how you can write a measure in DAX that helps with TOP N filtering. However, you may not need that calculation for many situations. If all you want is just simply to get the top 10 customers based on the sales amount, or bottom 5 products, etc, then you Read more about TOP N Filter in Power BI with Zero DAX Code; Visual Level Filter[…]

Power BI Design Tip; Design for Mobile Device

Power BI is a mobile-friendly reporting solution. Every report that you generate can be viewed on the Mobile too. However, it doesn’t mean that the report is designed for mobile, or in other words; it doesn’t mean that is it a mobile report page. You have to make some changes, and take some extra considerations for Read more about Power BI Design Tip; Design for Mobile Device[…]

Sparkline in Power BI

So you want to add a sparkline in a Power BI report and wonder how to do it. Fortunately, the Power BI team recently added that functionality, and it is very easy to use. In this blog and video, I’ll explain how it works through a demo. Video What is the Sparkline? Sparkline is a Read more about Sparkline in Power BI[…]

Power BI Icon Names for Conditional Formatting Using DAX

I have previously written about conditional formatting in Power BI, and how you can take one step further with using DAX to dynamically change the conditional formatting. Conditional formatting with DAX for colors is easy, you can use the color name or their hex code. But for Icons, it is slightly different. You can either Read more about Power BI Icon Names for Conditional Formatting Using DAX[…]

KPI Visual in Power BI Explained

If you are showing an important measure value in the report, and you want to compare it with a target and see if it meets the target or not, The KPI visual comes in handy. The KPI Visual’s behavior, however, might be a bit hard to understand, In this article and video, I explained how Read more about KPI Visual in Power BI Explained[…]

Power BI Calendar Visual

Power BI doesn’t have a built-in calendar visual. Although there are some custom visuals for building a calendar, however, custom visuals come with some limitations sometimes. In this article and video, I explained how you can use built-in visuals to create a calendar visualization in your report. Video First step: Custom Date Table The first Read more about Power BI Calendar Visual[…]

Search Bar in Power BI Slicer

If you have too many items in a slicer, such as the list of customer names, or product names, then finding one amongst the list takes time, unless you enable the search. Fortunately, the search is there for you, you just need to enable it, In this very short article and video, I’ll explain where Read more about Search Bar in Power BI Slicer[…]

What a Power BI Hierarchy Is, and How to Use it?

Power BI hierarchies are a useful structure for drill-down and data exploration in reports. A hierarchy can be created simply and can add great value for you as a developer and end-users for better data analysis. In this article and video, I’ll explain what a Power BI hierarchy is and how to create it. Video Read more about What a Power BI Hierarchy Is, and How to Use it?[…]