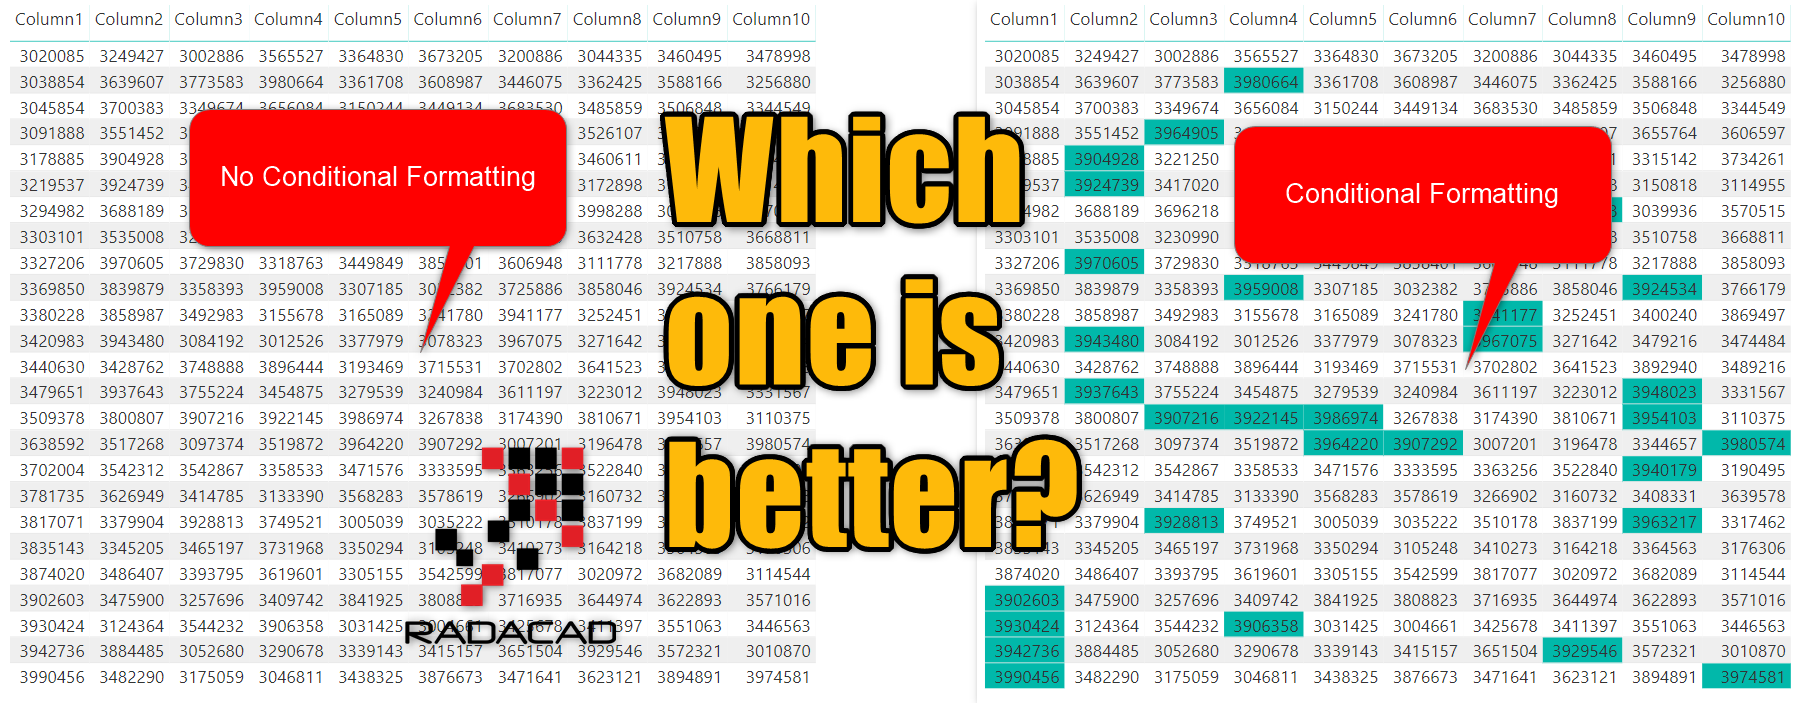
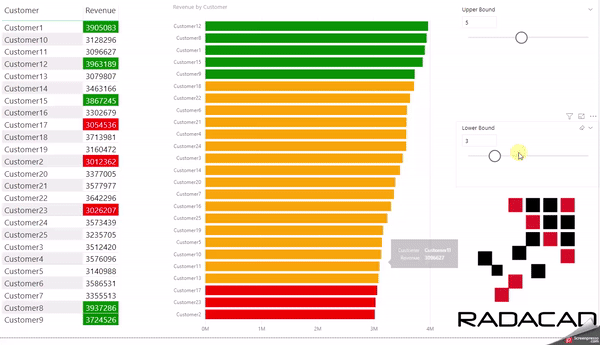
Better Drill Down Experience with Power BI

If you have used the drill down/up feature in Power BI, you know that it is a very powerful feature for exploring the data, you can expand a hierarchy to the next level, and go back. However, there is a little trick that can make your hierarchy exploration much better. Let’s check it out in this Read more about Better Drill Down Experience with Power BI[…]

Power BI Desktop; Getting Started – Part 2

In the previous post, you’ve learned what Power BI Desktop is, and how it can be used for getting data and also doing visualization. We used the Pubs sample dataset for that example. In this post, we continue the same example, with a touch on modeling and also more visualization. This post is part of Read more about Power BI Desktop; Getting Started – Part 2[…]

Top 10 RADACAD Blog Posts of 2018

With getting 2018 wrapped up, I would like to thank you all for visiting our blogs and giving us your most valuable feedback. Here in this post, I’ll point out some of the most viewed articles we have shared and links to our books. 2018 was a year for me that I did moderate on writing Read more about Top 10 RADACAD Blog Posts of 2018[…]

Ignite 2018 Interviews by Reza Rad; Power BI and AI

I’ve been honored and had the opportunity to have an interview with some great minds in Ignite 2018. Just to mention a few; it was the discussion about all new Power BI and AI features announced at Microsoft Ignite 2018 conference. In this post, you will see the link to all my 14 interviews of Read more about Ignite 2018 Interviews by Reza Rad; Power BI and AI[…]

Master Detail Design with Drillthrough Filter in Power BI

One of the most common requirements in any reporting solution is the ability to drill through from master page to the details page and see the details of an item or category. In this post, I will explain how this feature is simply possible in Power BI, and what are things to consider when you Read more about Master Detail Design with Drillthrough Filter in Power BI[…]

Create Custom Visual with R and JSON- Part 4

In the last Post, I have explained some parts of creating Custom visual such as how to create an icon, name of visual, and the how-to allocates fields to a custom visual. There are some other settings that need to be set up beforehand as well. the number of data fields you able to pass to Read more about Create Custom Visual with R and JSON- Part 4[…]

Bookmarks and Buttons: Making Power BI Charts Even More Interactive

In the previous post, I explained a usage of bookmarks and buttons in Power BI, which was for clearing all slicers. Buttons and bookmarks are the gold combination in Power BI. You can do wide range of creative activities with this combination. In this post, I will show you some other usages of buttons and Read more about Bookmarks and Buttons: Making Power BI Charts Even More Interactive[…]

Create Custom Visual with R and JSON- Part3

In this post, I am going to show you how we can create most comprehensive Custom visual. In the last two posts published in July 2017 (post1 and Post 2). Some notes before I am going to complete the last two posts. 1- We able to declare some custom input like X, Y, Legen and Read more about Create Custom Visual with R and JSON- Part3[…]

Clear All Slicers in Power BI; A Bookmark Story

Using bookmarks for clearing all slicers in Power BI is not a a new function, I have been using it for many months, and advising many people to do it that way. However, I still get a lot of questions in my presentations about how to do that. That is why I ended up writing Read more about Clear All Slicers in Power BI; A Bookmark Story[…]

Road Map to use Microsoft ML tools

I normally work with most of the Microsoft tools for the aim of doing machine learning. I came up with a roadmap that shows what option for machine learning we have with Microsoft tools in Data Platform. this roadmap is not completed yet, I need to update it one later with some tools such azure Read more about Road Map to use Microsoft ML tools[…]