

The trick I am about to explain in this article is used in many samples, and it is not a new trick. However, it is very useful, and many Power BI users are still not aware of it. Let’s say you have to columns: Cost, and Sales, and in one chart, you want to show only one of the measures above, but the selection to be done in a slicer. You want the user to select either the cost or sales and then see that value in the visual. Another example is that you have all the time intelligence calculations as measures, and you want to have a slicer to select what to show as the value in the chart. In this article, I’ll explain how you can do that.
Sample Report
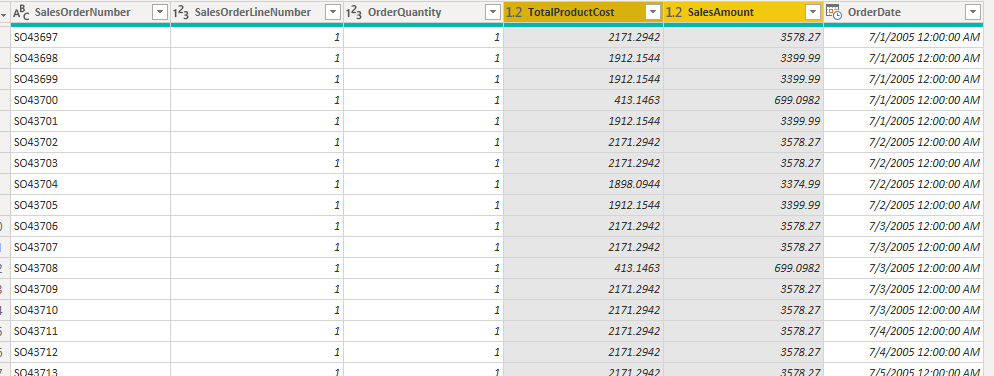
I have a sample report with a single table “FactInternetSales”. This table has a column for SalesAmount and a column for TotalProductCost.
I also have a measure created for Sum of the SalesAmount, and Sum of the TotalProductCost (having a separate measure is not necessary, but will make your solution cleaner in the future);
Sales = SUM(FactInternetSales[SalesAmount])
Cost = SUM(FactInternetSales[TotalProductCost])
In addition to the two simple measures above, I do also have some other measures with time intelligence calculation on the Sales;
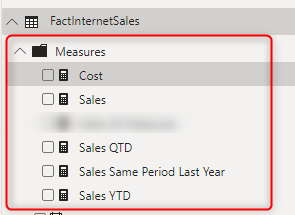
I am not going to copy the expression for each measure here, just one of them for example; (the rest you can find in the downloaded file)
Sales Same Period Last Year =
CALCULATE(
[Sales],
SAMEPERIODLASTYEAR(FactInternetSales[OrderDate].[Date])
)
The goal is to have some visuals showing a value of one of the five measures above through selection of a slicer;
Parameter Table, Measures Table
The first step to achieve a slicer with all measure names in it, is to create a table with the name of all measures. We call this a parameter table also, because this is a table with parameter values that we pass to another calculation later on.
This table can be created anywhere, in Excel, in your data source, or even in Power BI. However, I do recommend to create it outside of the Power BI and then import it (because then for any changes in this table, you won’t need to open the Power BI file). for this example, however, for simplicity, I created it in Power BI;
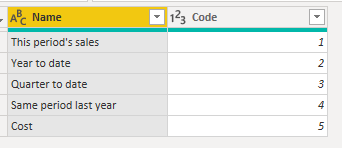
I called the table Measure Selection. The code column in the table above is not necessary, however, it makes it much easier to change the names that you want to show in the slicer without worries about changing the DAX expressions.
Once the table is loaded into Power BI, make sure this table is not connected to the other tables.

A parameter table should NOT be related to other tables. This pattern is also called a disconnected table pattern exactly because of this. This is using the same approach that What-If parameter in the Power BI does, the only difference is that you create it yourself rather than through a graphical interface.
Selected Measure DAX Expression
Now you need a way to determine which value is selected from this table (Measure Selection table) in the slicer, You can achieve that with creating a measure using SELECTEDVALUE() function;
Selected Measure = SELECTEDVALUE('Measure Selection'[Code],1)
You notice that I have used the Code column in my measure. The reason is that if later on I decide to change the name of “Sales” to “Revenue”, I can do that easily without needing to change my DAX expressions that comes later in this article.
Another thing to notice is that I have a default value in case nothing is selected in the slicer: 1. You can change that to anything else based on your need, or even not to have a default value.
Again, it is not mandatory to create a measure for this, the SELECTEDVALUE can be used directly in other measures that you want to use, but it makes your solution cleaner this way.
A Measure to Switch
Now comes the last piece of puzzle. You need to write a measure expression that based on the Selected Measure (the measure with the calculation above), returns the relevant measure’s value. Here is an example for that.
Sales All Measures =
SWITCH(
[Selected Measure],
1,[Sales],
2,[Sales YTD],
3,[Sales QTD],
4,[Sales Same Period Last Year],
5,[Cost]
)
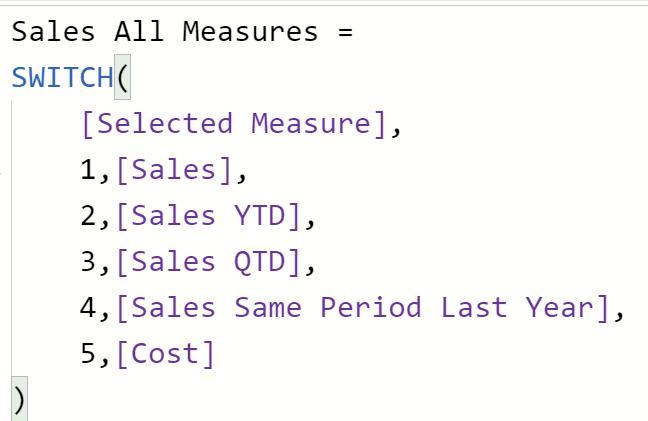
This is a simple expression using the Switch function. Switch function, which I explained in another example here, is like a bunch of If/Then/Else statements.
Now you can use the “Sales All Measures” in any visuals you want, I used it in an area chart and a table visual;
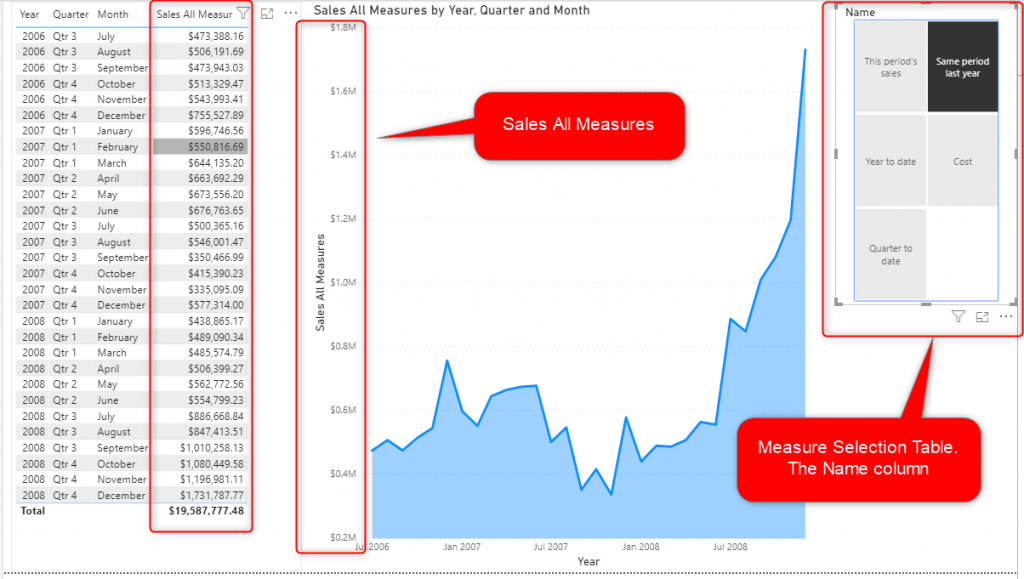
This now works just fine. With the selection of a measure name in the slicer, you’ll see the values in both visuals changes.
However, you might want to take one more step further. Instead of showing “Sales All Measures” in the title of the charts, you want to show the actually selected measure. That can be done easily with a conditional formatting and another measure.
Title Measure
You can use the SELECTEDVALUE() DAX function this time to fetch the Name, you can even combine it with any other strings you want to build a title text.
Selected Measure Name = SELECTEDVALUE('Measure Selection'[Name])
This measure now can be used in the title of any visuals that accepts the conditional formatting. Here is how to do that.
Set the Title Expression
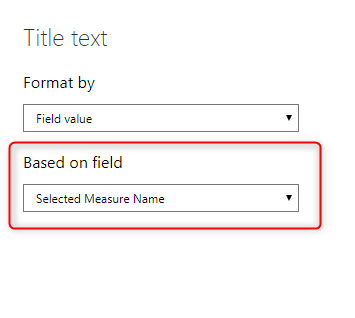
Select a visual that you want to set the title of that dynamically, then go to Format, and under Title, click on fx.

In the Title text set the “Based on field” as the title measure, in my case, it was called Selected Measure Name.
You can do this for both charts. and now you have everything working as you wanted;
Summary
The parameter table pattern is a useful pattern in many scenarios. You can use it for measure selection, for conditional formatting, changing colors etc. This is one of the areas that DAX gives you wings to do things you want.
If you have any questions, feel free to ask in the comments below, or reach out to me for consulting and training help.
Download Sample Power BI File
Download the sample Power BI report here:
Video


Reza is author of more than 14 books on Microsoft Business Intelligence, most of these books are published under Power BI category. Among these are books such as Power BI DAX Simplified, Pro Power BI Architecture, Power BI from Rookie to Rock Star, Power Query books series, Row-Level Security in Power BI and etc.
He is an International Speaker in Microsoft Ignite, Microsoft Business Applications Summit, Data Insight Summit, PASS Summit, SQL Saturday and SQL user groups. And He is a Microsoft Certified Trainer.
Reza’s passion is to help you find the best data solution, he is Data enthusiast.
His articles on different aspects of technologies, especially on MS BI, can be found on his blog: https://radacad.com/blog.
Hi Reza,
Very nicely explained. This article was much required to understand how to implement this in our reports. Your articles and YouTube videos are of great help to PBI Community. Keep up the good work.
Thanks
Shubham Gurav
Thanks ?
Thanks for the information. I hope will learn a lot as I am working hard to upgrade myself.
Hi Reza, Is it possible to show and hide dimensions as you have shown for measures in matrix or table visualization.
Hi Mohsin
what do you want to do actually? what is the purpose of hide/show dimensions?
Cheers
Reza
Hi Reza,
Can you please let me know , you have created video or post for “Slicer based on column names (not column values)”
What do you want to achieve?
To select the column name in the slicer, and see the value of that column in the visual? isn’t that similar to this example already?
Cheers
Reza
Hi Reza,
Great article! Thanks very much for posting.
Everything is working great, but I am having one issue. The values update correctly in my visual as I switch between measures, but their formatting is lost. For example, a measure that returns a percent will now show as a decimal (1.0 instead of 100%).
Any thoughts on how to get the formats to stick?
Thanks again!
– Jay
Hi Jay
where did you set the format?
if you do it at the field level in the Column tools, then it should stay like that
Cheers
Reza
Hi Reza,
Thanks for a helpful tutorial!
Like a couple of others who has commented, I am looking for a way to change the column rows, rather than the measures liken in your example.
Say I want to calculate Sales, but change if it is calculated per country, year, store, etc. SWITCH() requires different measures, but I want to add the different columns instead (year, Country, store..).
Do you have any suggestions on how to do this?
Thanks,
Therese
I realized I need to clearify 🙂 I want to make a table with two selectable columns, In the first column selection between several date dimensions (year, month, week) and the other column selection between country, store etc.
If it was only one column to changes values on I could use a pivot table and de standard arrows to drill up or down to change column. But since I want to have two separate columns with different available values I cant find a descent way of doing that.
Cheers,
Therese
Can you please share a screenshot of your table’s data?
my first feeling (without looking at your data) is that the design needs to change. If you have values of country, store etc in one column, they have to be pivoted in multiple columns.
But without looking at data I can only say that much.
Hey Reza,
What if I would to select an visualize two different measures at the same time? It seems the chart sums them up.
Thanks a lot, cheers
you can change your slicer to be single-select to avoid it
however, if you want to have a multi-select option, then you have to change your DAX code to accommodate that.
Hey Reza,
Immensely useful stuff! Thanks a bunch.
Have a similar problem where i am working with multiple calculated columns that need to switch based on slicer selection. The columns are however non-numeric. As an example you could consider a pie with a measure & two categories. The category needs to change based on slicer selection. Is that possible using DAX?
using measures as the Axis and the legend/category isn’t yet possible.
you can do a similar thing with Bookmarks instead of DAX
Cheers
Reza