
There is need to isolate the development and production environment in most of all projects. Setting up these environments help us to deliver a more reliable product to our customers.
Machine learning projects also need a development, Test and Production environment.
In this post, I am going to show you how we can do this in Power BI environment with help of M language and Power Query.
what is development mean in Machine learning projects?
according to the below chart (Data science LifeCycle), after business understanding, we need to get the data and do the modelling. We can put the Data Acquisition and Modeling stage into the development environment. The final stage that is the deploying model should be put in the development environment.
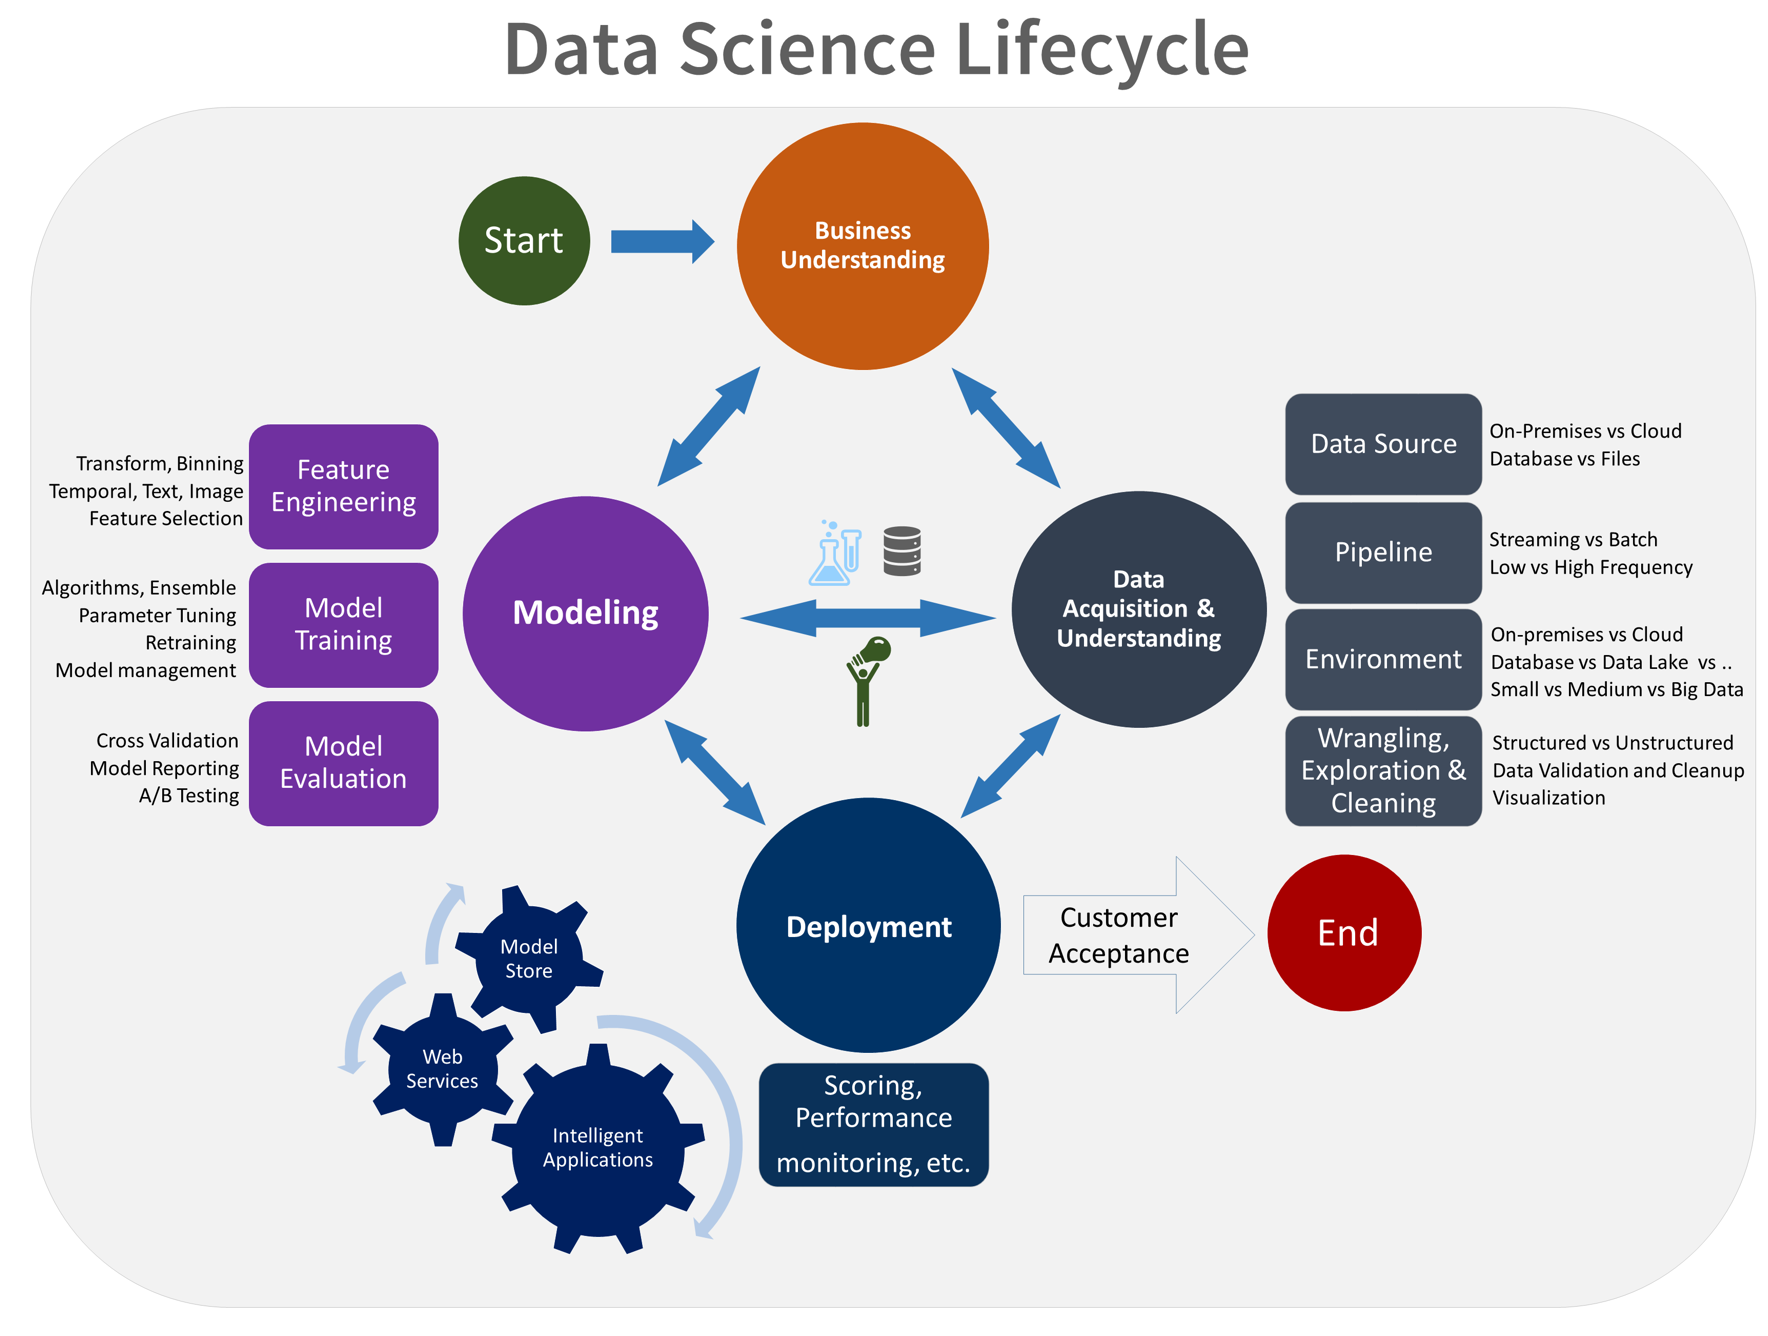
Figure 1. Data Science Life Cycle- Proposed by Microsoft Research
To make it simple we need an environment to train and test model. another environment for deploying the model. so the end user able to work and do the prediction.

Figure 2. The Different Environment to Machine Learning
Different Environment in Power BI- Power Query
I am going to run a predictive analysis for classification problem in Power Query using Decision tree algorithm (rpart for this example). Just a review, Power BI is a self-service BI tools. Power BI is used for data visualization, data integration, and modelling.
There is a possibility to run R codes inside Power BI/ Power Query. I am going to power query via Edit Queries.
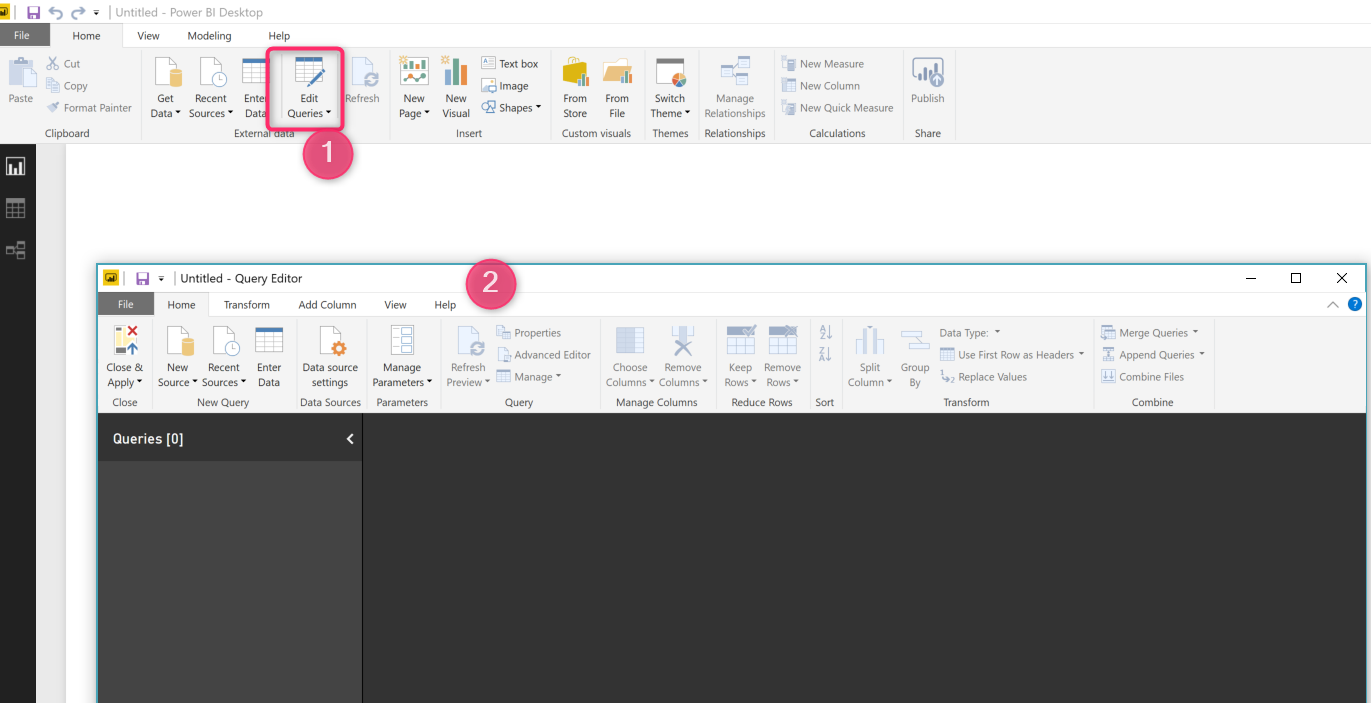
Figure 3. Edit Query Windows
In Power Query choose New Source-> Text/CSV, then brows a file (titanic.csv). The Titanic dataset is like Hello world for data science. This a free dataset which you can download it from https://www.kaggle.com/fossouodonald/titaniccsv/data. Just load the dataset. After Loading the dataset you able to see below windows
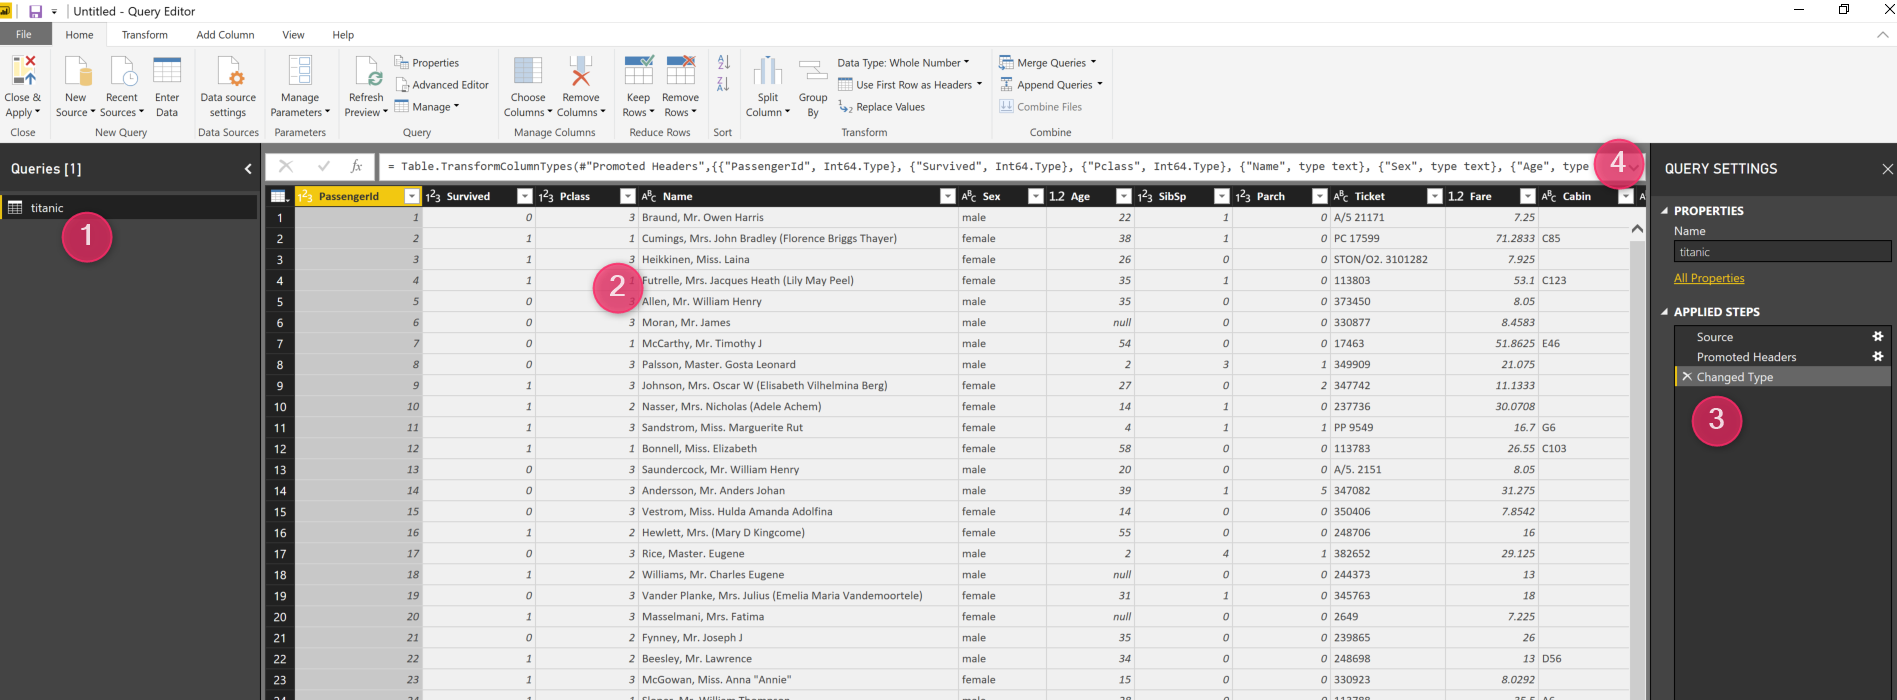
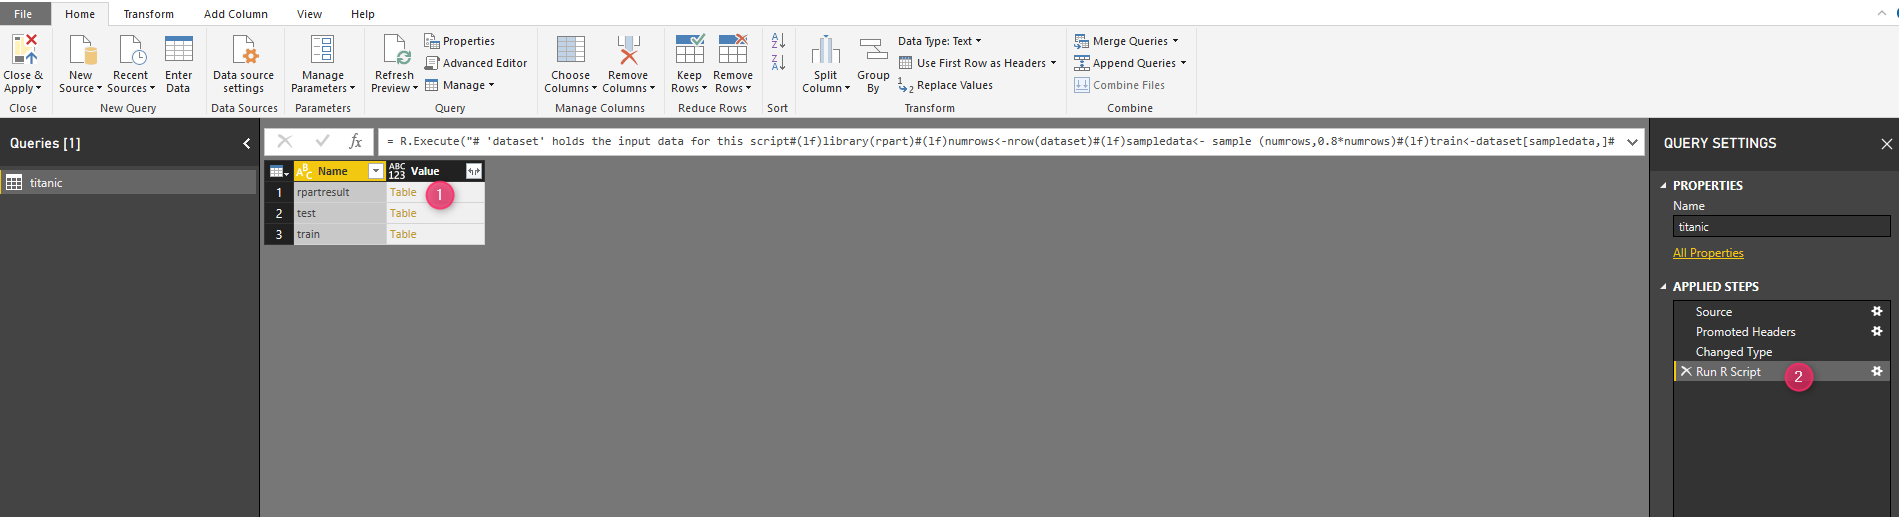
Figure 4. Power Query Environment, After Loading the Titanic Dataset
As you can see in figure4, in number 1 we have the dataset name under the query group. The second area is number 2 in Figure 4, that show the data column and attributes for Titanic. In number 3 in above figure, you able to see the steps for getting the data from resource change the column type (these steps automatically applied). Finally, in number 4, there is a code Editor for M language. M language enhances the possibilities to do data cleaning and data wrangling for us.
Click on the Transform tab and then in Run R scripts

Figure 6. Run R scripts
You should see an R scripts Editor that helps us to run our R codes (see post).
Training Environment
We are going to predict a person with a specific age, gender, passenger class is going to survived or not. To address this issue I have written the below code:
library(rpart)
rpart is a famous R package for decision tree. I already installed this package in Rstudio and then here I just refer to it.
In next step, I am going to specify the training and test dataset. to this aim first I calculate the number of rows in the dataset using below command:
numrows<-nrow(dataset)
In next step, I am going to sample data 80 percent to training and 20 percent for testing.
sampledata<- sample (numrows,0.8*numrows)
train<-dataset[sampledata,]
test<-dataset[-sampledata,]
Now the dataset for training is ready. Following, I leverage rpart function to create a decision tree model. the first parameter is the formula for creating a g model (Survived ~.). the second is training dataset and the last one is the method. The method for this prediction is classification, so for the last parameters I use “class”.
DT<-rpart(Survived~.,data=train,method=”class”)
Finally, I use predict command to apply test dataset to our created model.
prediction<-predict (DT,test)
To show the result of the prediction, I created a data frame from prediction result and the test dataset.
rpartresult<-data.frame(prediction,test)
Finally, by exploring the result, I got the below table. the first column is for people who not survived, the second column is for people who survived. and finally.

Training Environment
I am going to create a Training environment. As a result, other users able to apply rpart for classification or regression in their data.
Step 1- Create a function
In the first step, Ia m going to right click on the titanic query, to create a function.
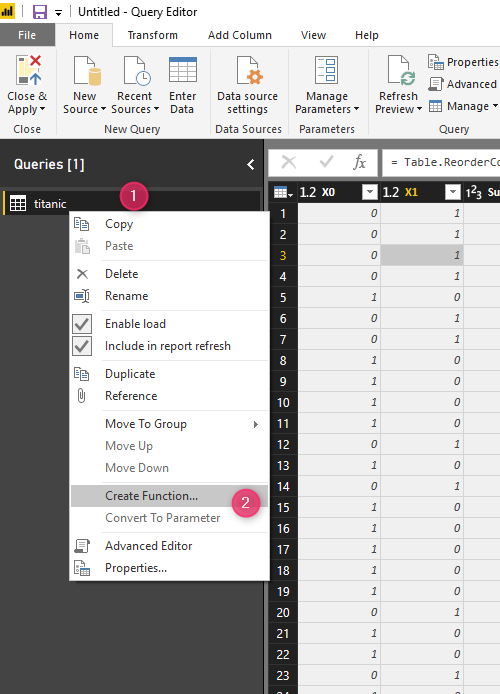
Then, assign a name to function such as “rpartFunction”
As you can see in the below figure, we create a function that still does not have any arguments. To pass arguments to this function, we need to click on Advanced Editor (number3)

So the advanced editor in Power Query is a place that we able to write M codes. To learn more about M please see a post by Reza Rad.
I am going to change the first three lines as below.
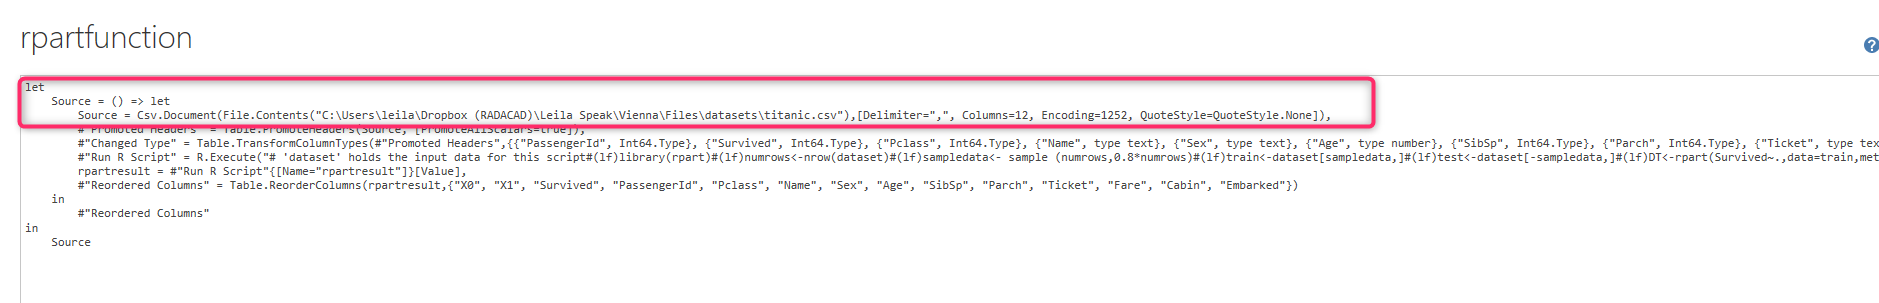
replace the first three lines code with below codes
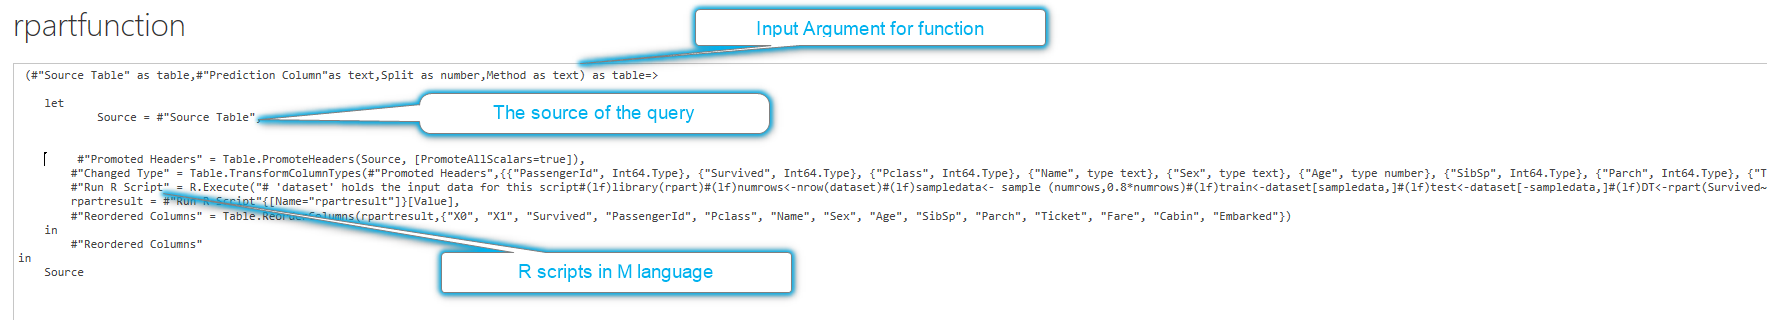
(#”Source Table” as table,#”Prediction Column”as text,Split as number,Method as text) as table=>
let
Source = #”Source Table”,
I am going to change the code as below. As you can see in the figure, the first line identifies the input for my function. I have four
1- source table – the table for training
2- Prediction Coulm- what attributes we are going to predict
3-Split- how much of data should go for training and how much for testing
4-Method- the prediction is for classification or regression
Also in line6, we able to see a tag for “RunRscripts” and you able to see the code already written in R script editor.
now I need to remove all steps before running the R scripts and put the parameters inside the R codes.
Now we need to do some more changes to the code as you can see in the below figure.
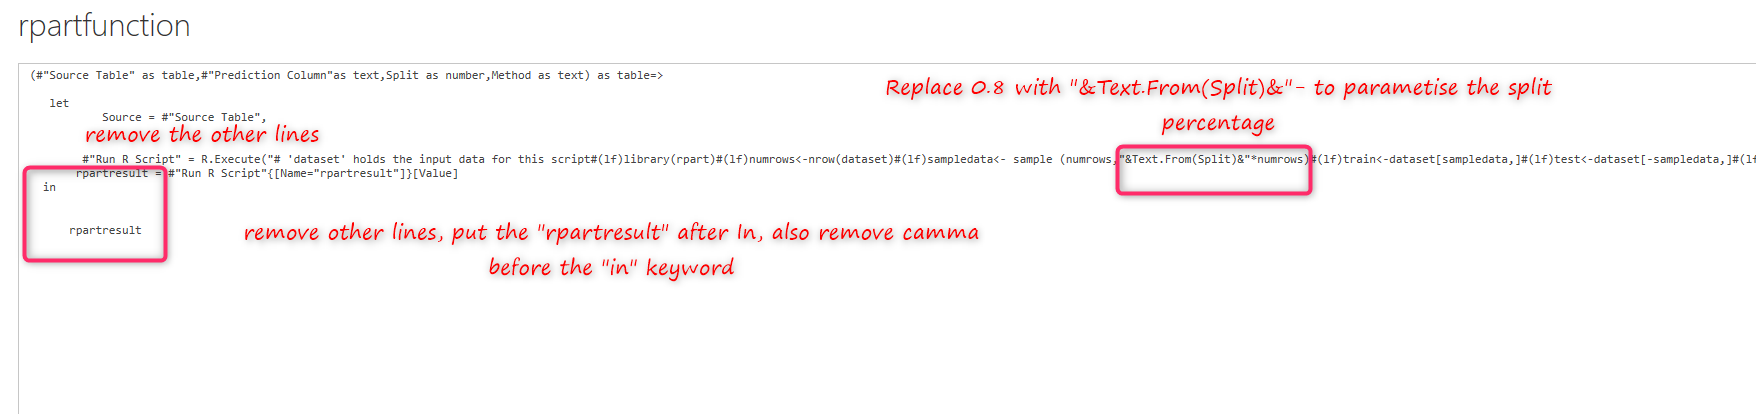
The figure shows that we remover other lines till running r scripts. then we start to replace some variable. For instance, in above figure, we replace the 0.8 with “&Text.From(Split)& “.
we need to substitute other variable like Survived, Method and data source as well
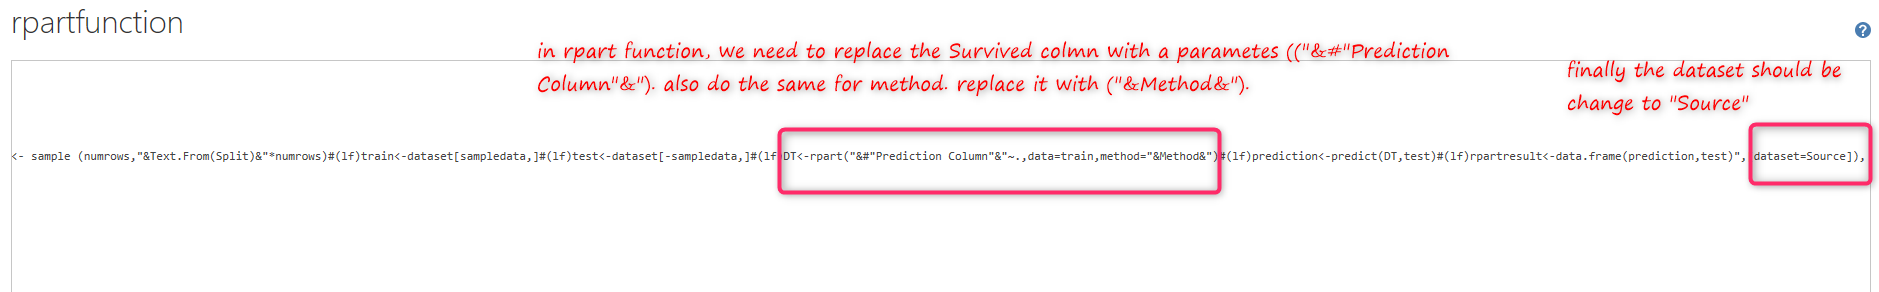
As you can see in the above figure, in the rpart function, we replaced the Survived with: “&#” Prediction Column”&”, also we replace the “class” with “””&Method&”””. Finally at the end of the line for the dataset, we replace it with “Source”.
now we have four parameters that have been replaced in the code.
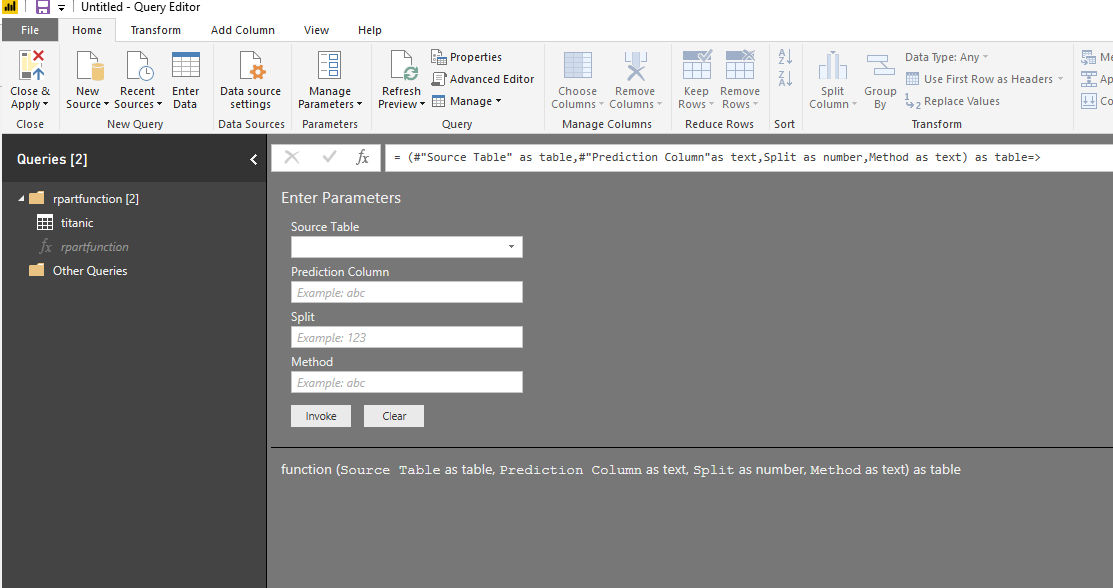
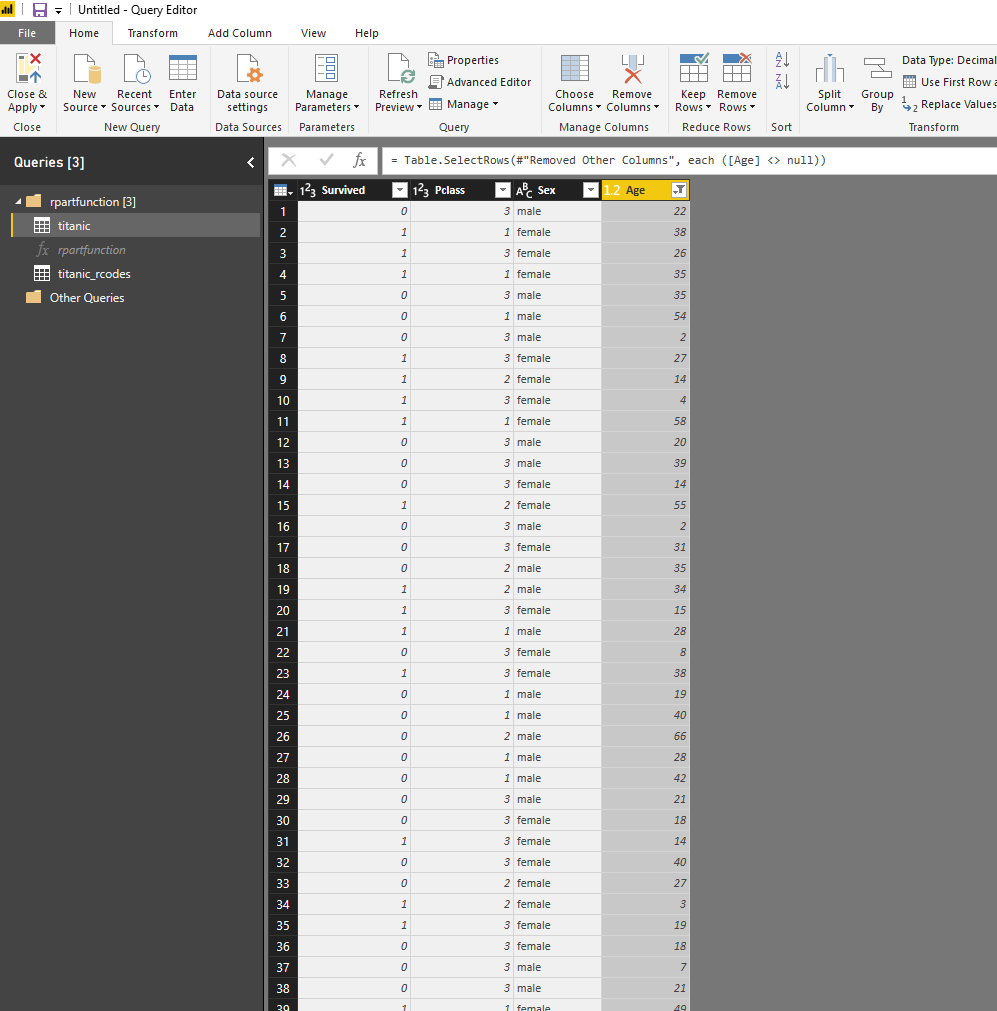
As you can see in the above, now we have four main parameters. To run the code we just need to provide the data. I create a new dataset for titanic that only has the four main columns, and all null values have been removed.
Now I am going to call the function by providing the
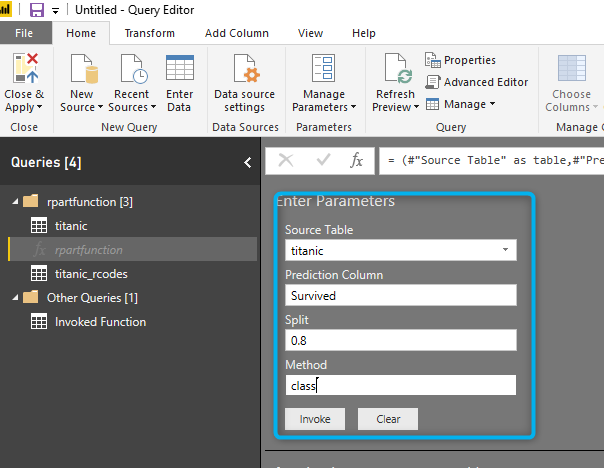
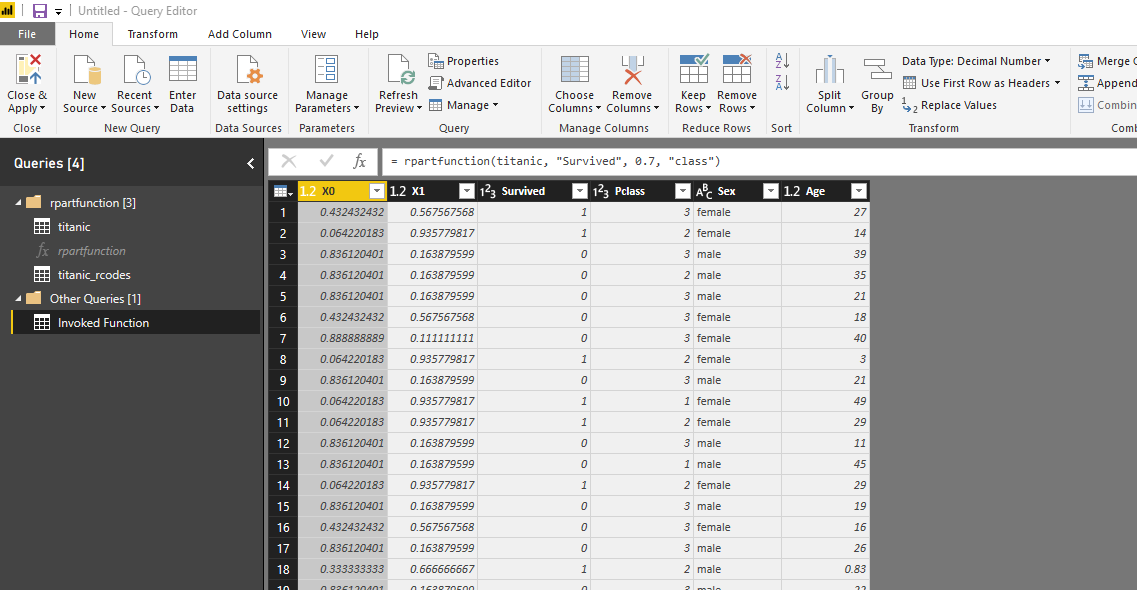
After invoking the code, the result of prediction will be shown as a new query.
Now I am going to import a new data set for the cancer and apply the function rpart to it for predicting a patient become benign or malignant.
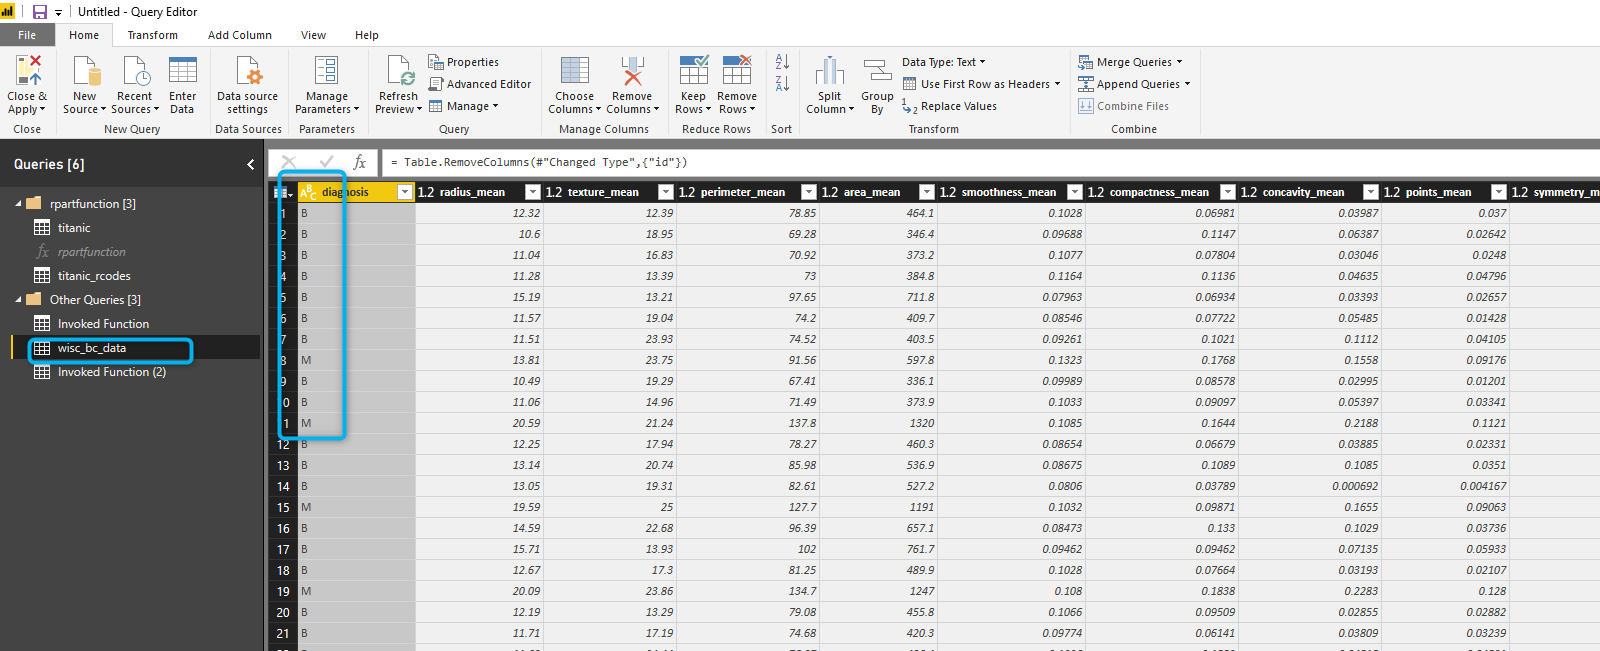
for this post, I did not normalize the data for cancer data. but there is a need to do some data preparation (see the post about KNN). I provided the data for invoking the rpart classification function as below
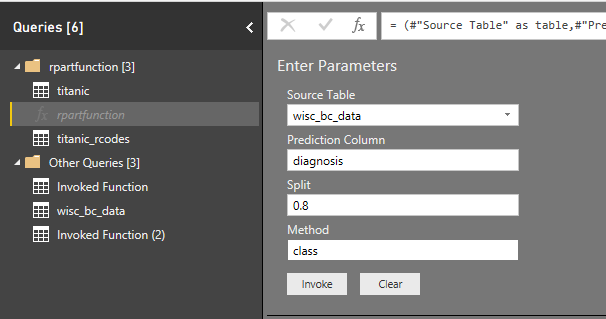
after invoking the function, it gets permission to run the query and show the r scripts that are going to run.
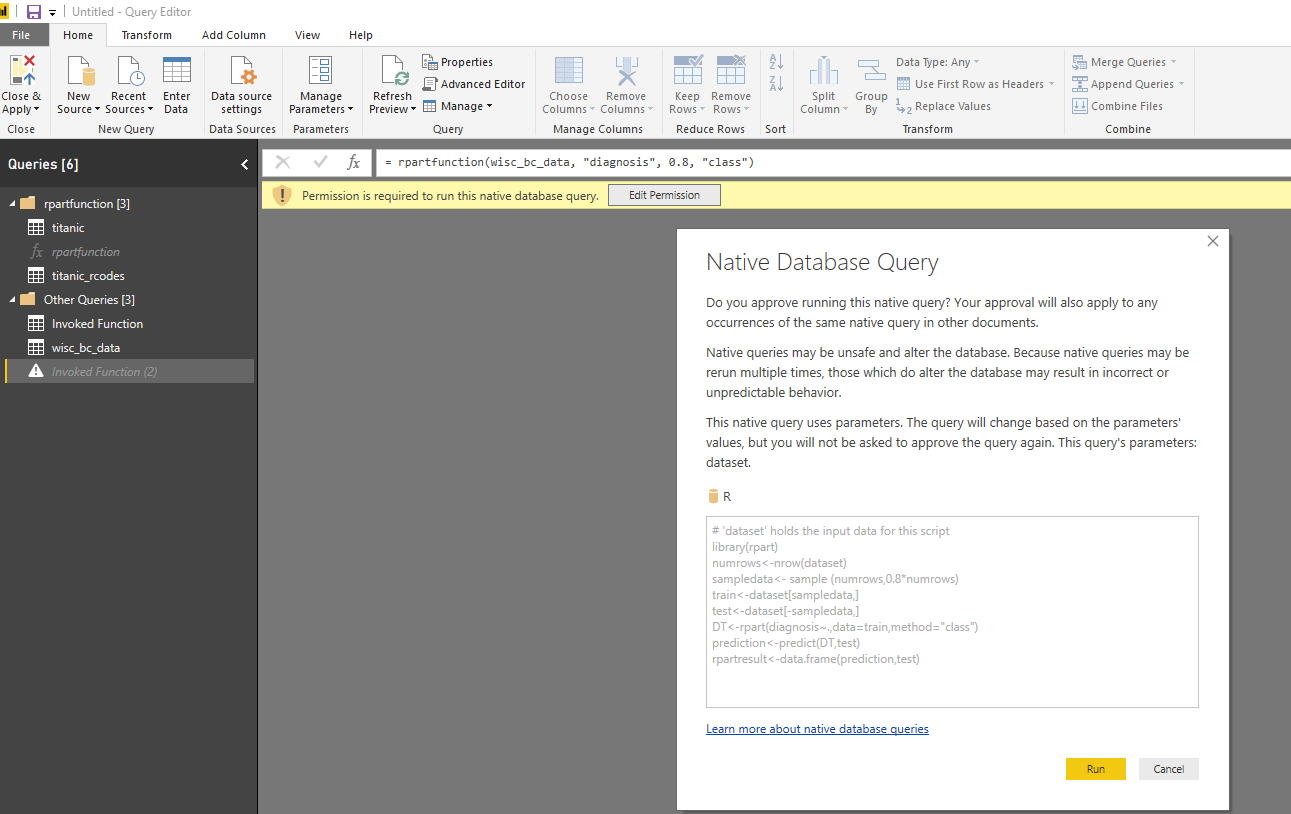
after running the code the below result has been shown

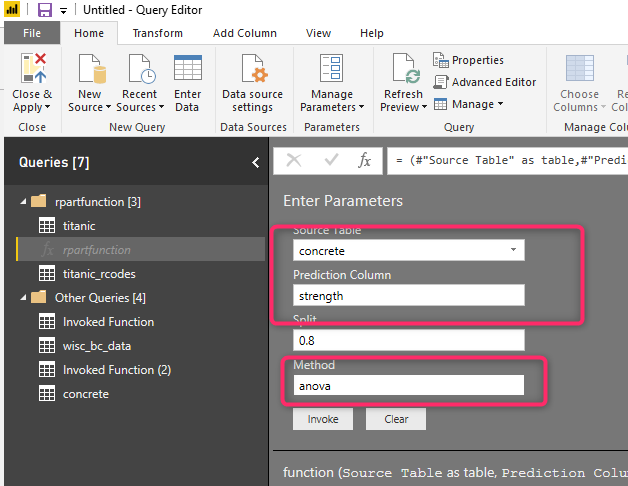
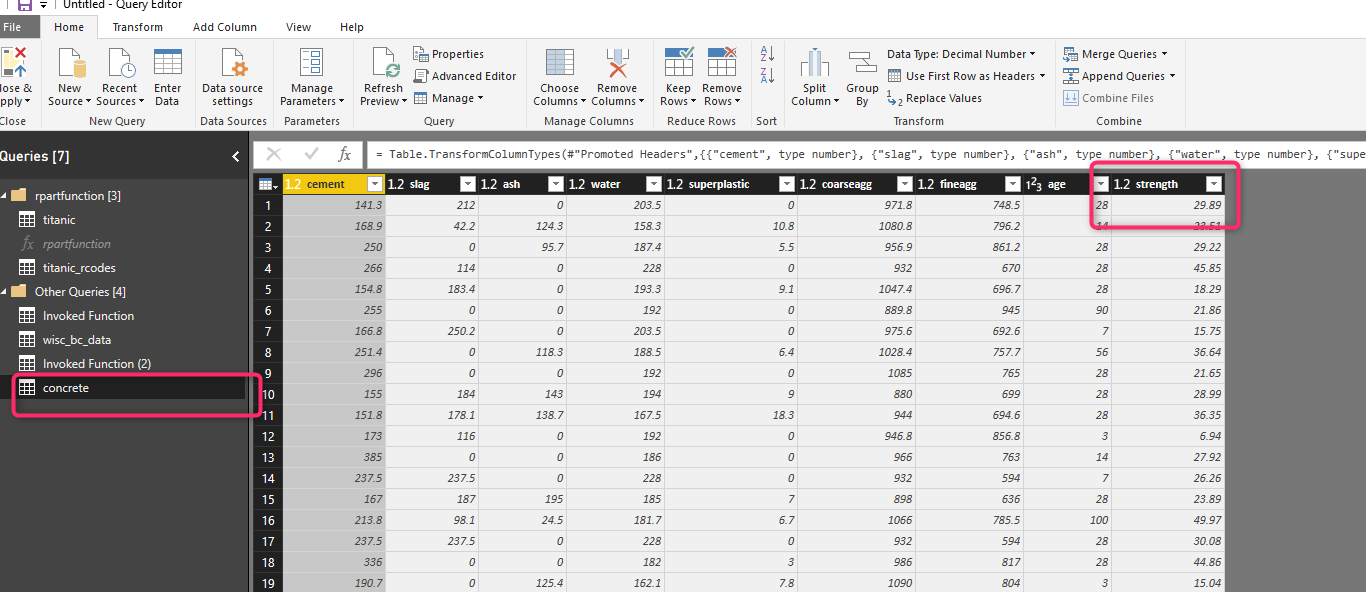
Now in another exercise, I am going to use rpart to regression prediction. The concrete example in Post. I am going to predict the strength of the concrete.
I imported the dataset for concrete.
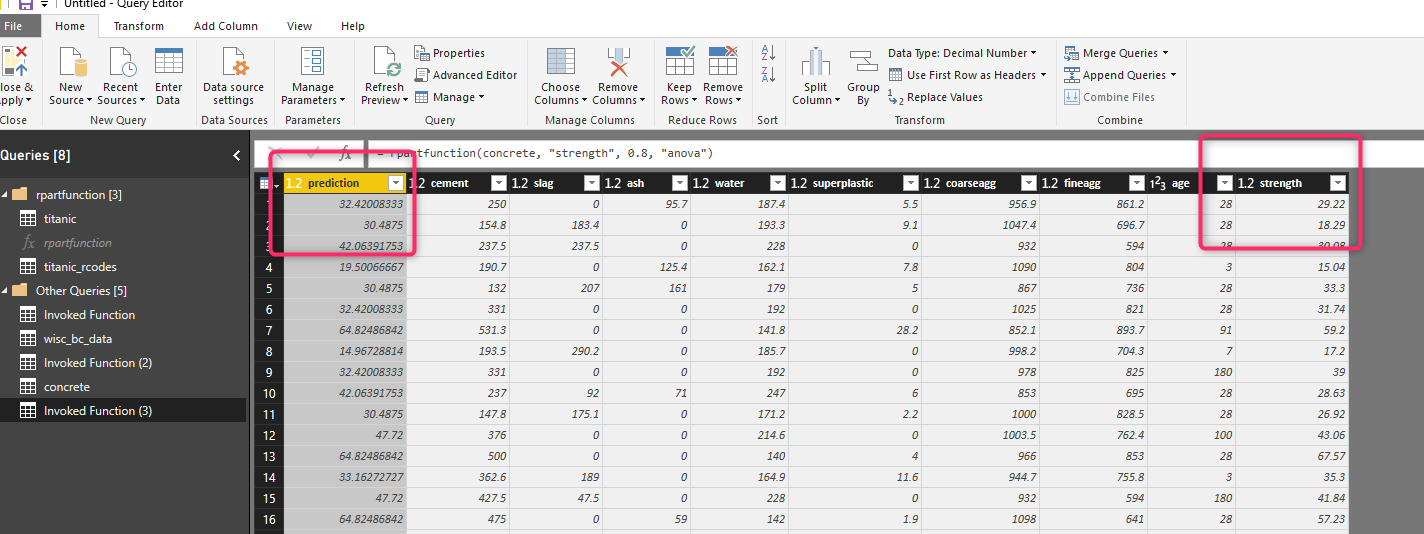
Now I am going to invoke the function for the parameters. As you can see in the below figure, the dataset is concrete, the prediction column is “strength”, the method this time is “anova” instead of class.
after invoking the function the prediction for the concrete strength has been shown in the separate query as below
In this post, you see how we can parametrize the training model in Power BI. I am going to show you how we can create a different group for testing and training in the next post.
In this post, I just cover the training environment.


Leila,
Great post, is really nice to see how PBI can be integrated with R and ML in general!
Is there a possibility to share this data model with us?
Best regards!
Thanks so much, I will ask the Admin how I can share the file with you
Thanks so much, I will check with blog admin
Hi there,
when i follow the link “https://www.kaggle.com/fossouodonald/titaniccsv/data” and download the file, i get a different file from your, only containing 2 coloumns.
Can you put in the correct link to the titanic dataset you used ?
Thx
Fabian
https://goo.gl/m2qdbi also try this one
Sure Please try this one :https://www.google.co.nz/url?sa=t&rct=j&q=&esrc=s&source=web&cd=3&cad=rja&uact=8&ved=0ahUKEwj0o-buqtTZAhVPv5QKHY8uCbYQFghHMAI&url=http%3A%2F%2Fbiostat.mc.vanderbilt.edu%2Fwiki%2Fpub%2FMain%2FDataSets%2Ftitanic3.xls&usg=AOvVaw1j63KEb1daRf8kqotv9b7B
Your posts are very intuitive. Thanks alot
My Pleasure