
In the last blog an introduction to the Decomposition tree has been provided.
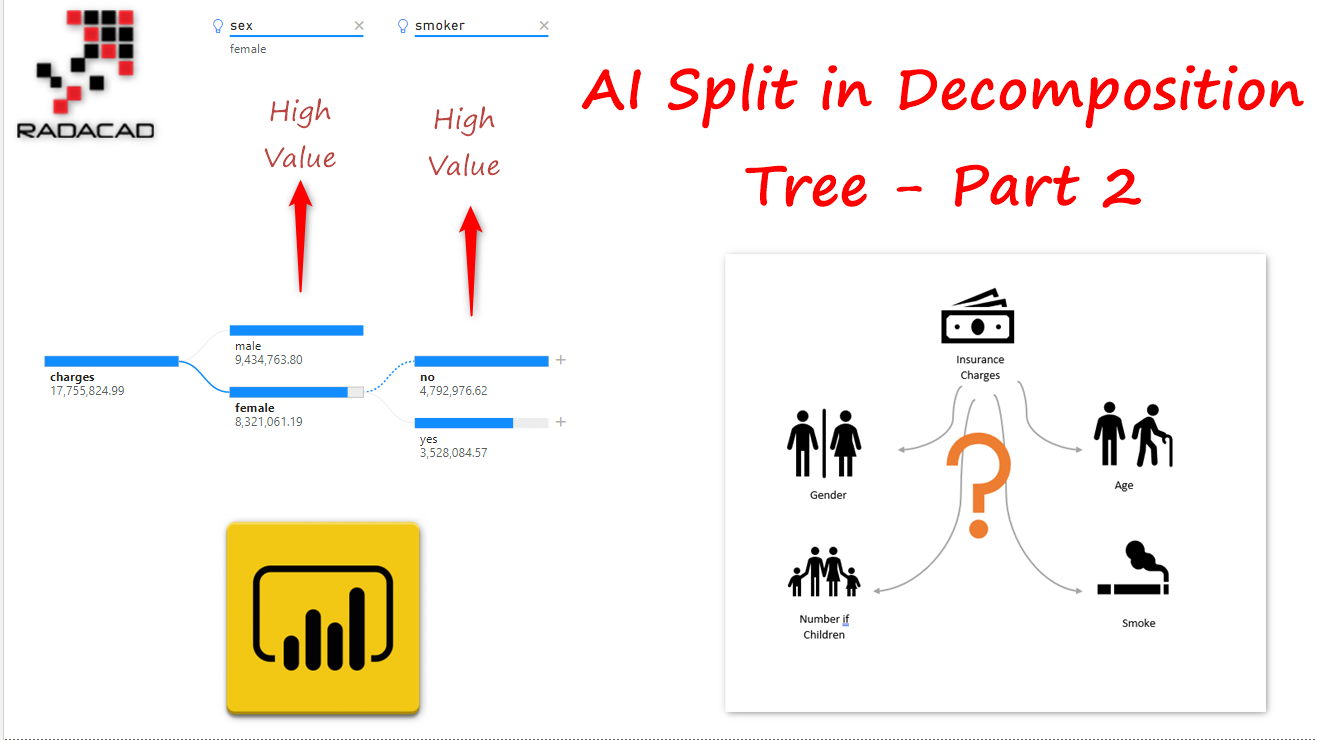
In this blog, AI split of the decomposition tree will be explained.
From last post, we find out how this visual is good to show the decomposition of the data based on different values.
There is another split based on the how other values has impact on the root data.
In this blog I will explained it using two different dataset, the one that we have from previous blog and another one that is about the insurance data.
we can split the data based on what has more impact on the analyse value
How it is work?
AI Split
AI Slit is a feature that you can enabl;e or disable it.
imagine we have a dataset about insurance charges regarding the Gender, age BMI people smok or not number of children they have and so forth.
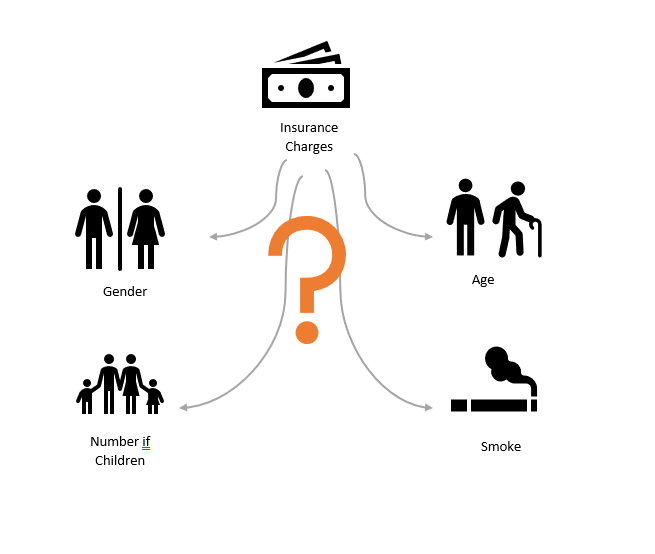
So start from importing the dataset into Power BI desktop and add the Decomposition tree to the report with analyse of Charges to be explained by Age, Gender, BMI, and so forth

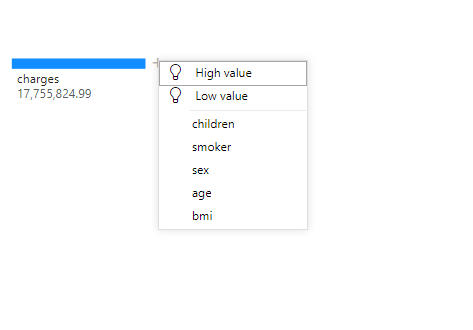
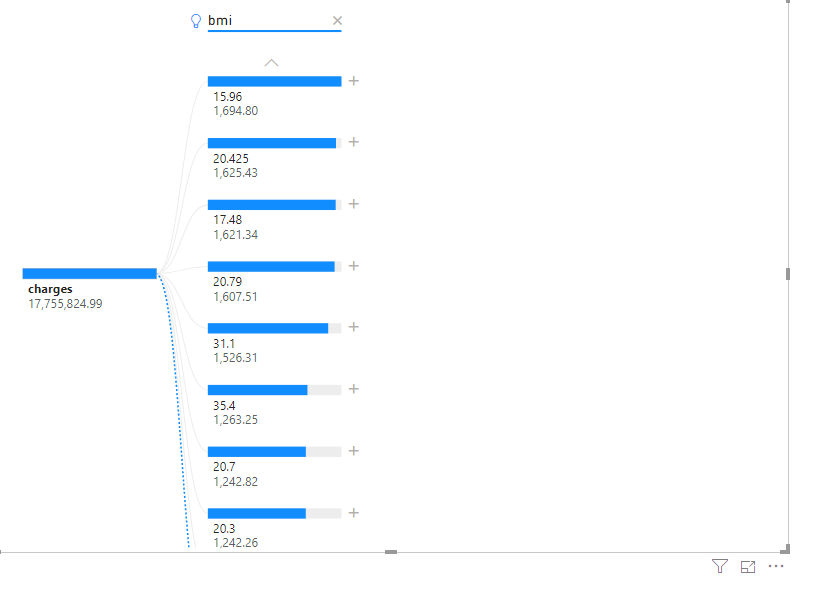
In the next satep, we have the parent node of the sum of insurance charges as below. If you click on the plus sign st the top of the menue you can see High Value and Low Value with Lamp sign,
What is their definition?
High Value
High value refer to drill into which variable ( age, gender…) to get to get the highest value of the measure being analysed[resource ]. Or in a simple way which of these variable has impact the insurance charges to be higher! t is so similar to correlation analysis to find out which factor has more impact to have higher charges
Low Value
Low value refer to drill into which variable ( age, gender…) to get to get the lowest value of the measure being analysed[resource ]. Or in a simple way which of these variable has impact the insurance charges to decrease! it is so similar to correlation analysis to find out which factor has more impact to have lower charges
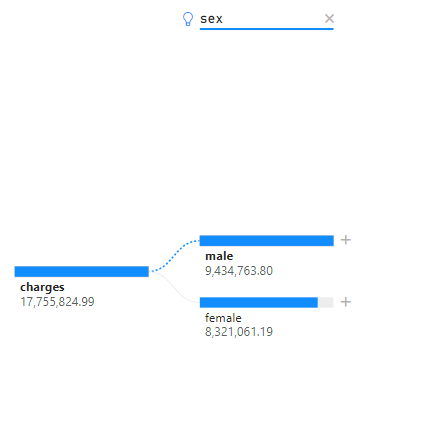
So in this example we find out the Gender of people has impact
Some notation
we do not Choose Sex to be selected, based on the algorithm the next level that has more impact on the charges to be hight is Sex of people.
Now in another analysis I want to know which of them decrease the amonth of charges. I remove the previous one and add the low value, as you can see in the below picture, BMI of people has impact to have lower charges peple with BMI 15, 20… has lower charges.
Now, you can have combination of them, I remove the second level and choose the High value again

So for charges to be Hight, if they are Men (charges with sum of 9 Million) and if they smoke (that is 5 Million) they have to pay more for insurance charges
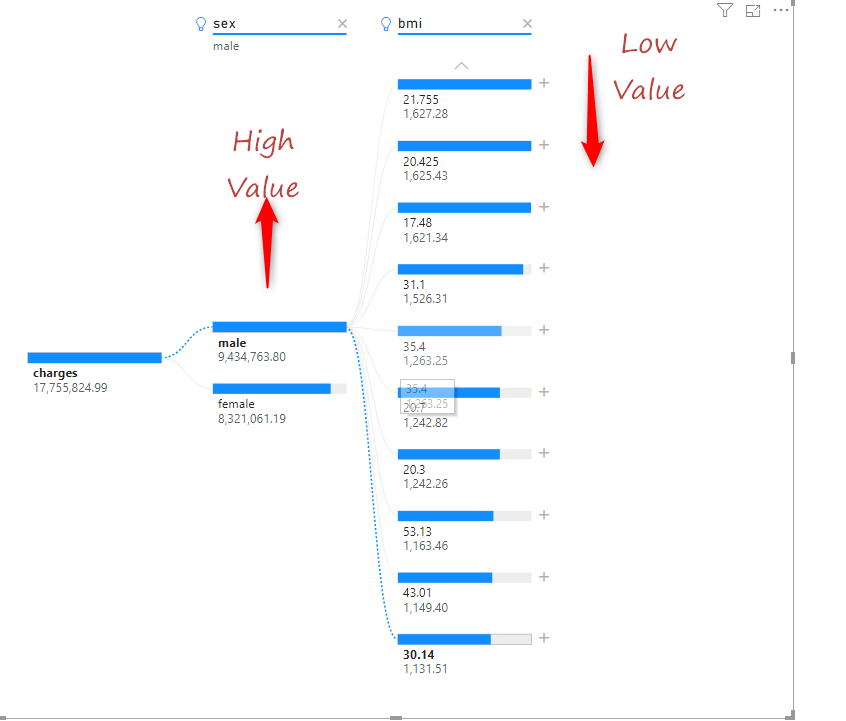
lets try other scenario : for a Men need to pay higher charges, but if the men with BMI of 21,20,17 and even 31 the charges would be low!
You can analyse it in different ways,
In next Blog, I will explained how to enable and disable AI Split and how to implement the relative and absolute concept
see below video


