
Power BI works with hierarchies very easily, and there are buttons to drill down and up. However, sometimes, these buttons are confusing for the users. It is essential to know what each drill down/up option is and how it works, not just for developers but also for the end-users. In this blog and video, I’ll explain that.
Video
Having a hierarchy in a Power BI Visual
You will see the drill-down/and up options on a visual if you have a hierarchy of fields in that visual. A hierarchy in a visual can be simply created by dragging and dropping multiple fields one after the other into the same field’s section of a visual. This can be also done by having a date field which is using the built-in Power BI date hierarchy and table.
For example, in the visual below I have SalesAmount as the Value of the column chart, and the Date field (OrderDate) as the X-Axis.
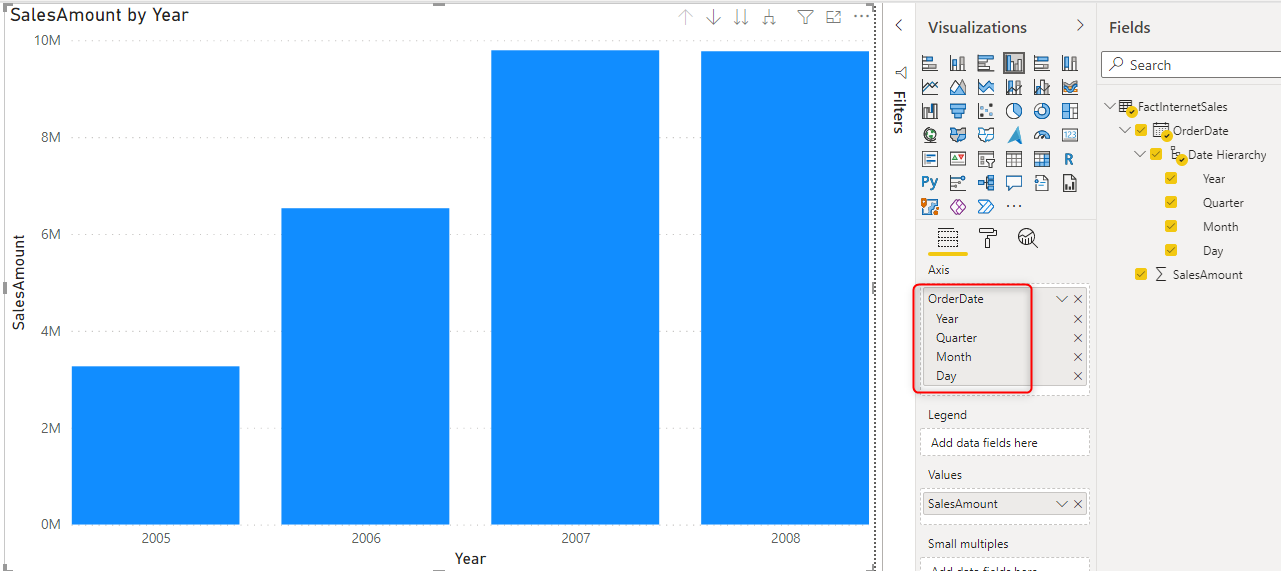
This will lead to seeing drill down/up buttons on the top of the visual (or at the bottom of it if the visual is touched at the very top of the report)

Let’s see how these options work
Selective drill down: Data Exploration
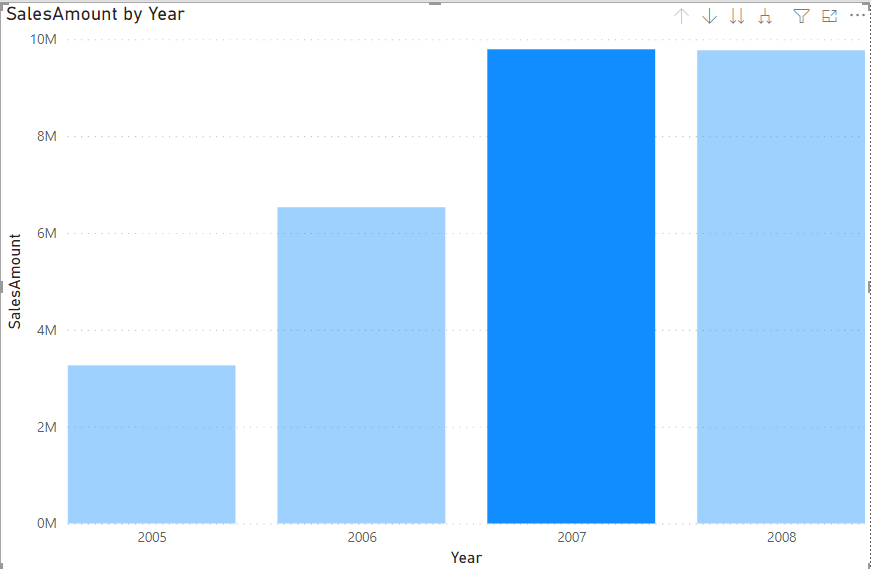
To understand the very first ability in the drill-down options, let’s see what is the default action when we click on a column in the column chart; The default action is that the column gets highlighted;
Now, let’s see what the selective drill down is. Click on the single arrow down, which is also called drill mode. and turn it on.
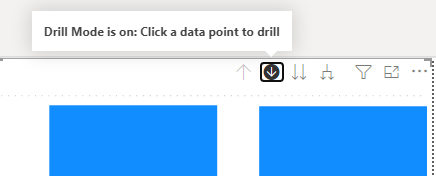
This means now that visual is in drill mode. If you click on a column, it will drill down to that section of the data, for example, If I click on 2007, then it will drill down to the quarters of that year.
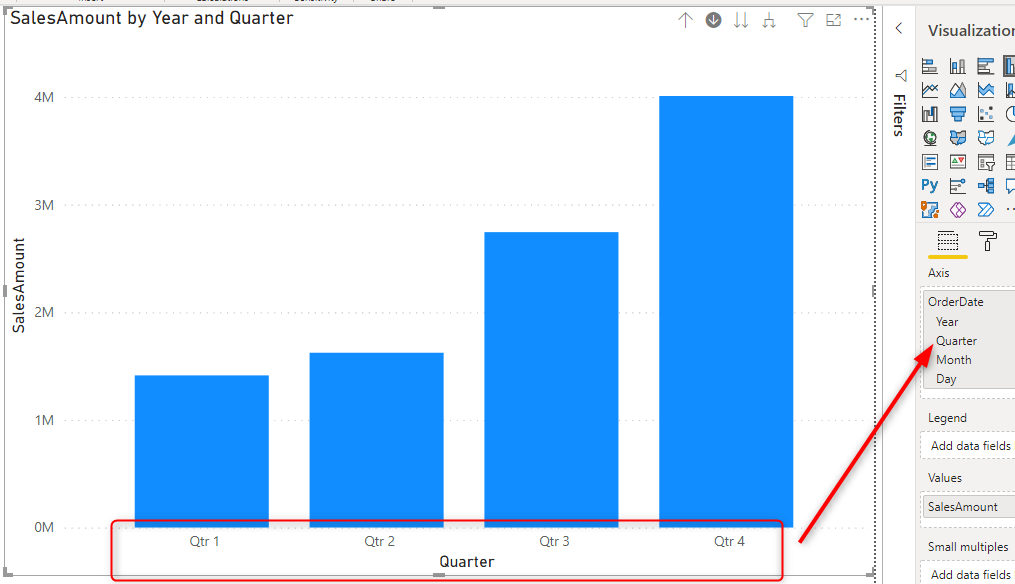
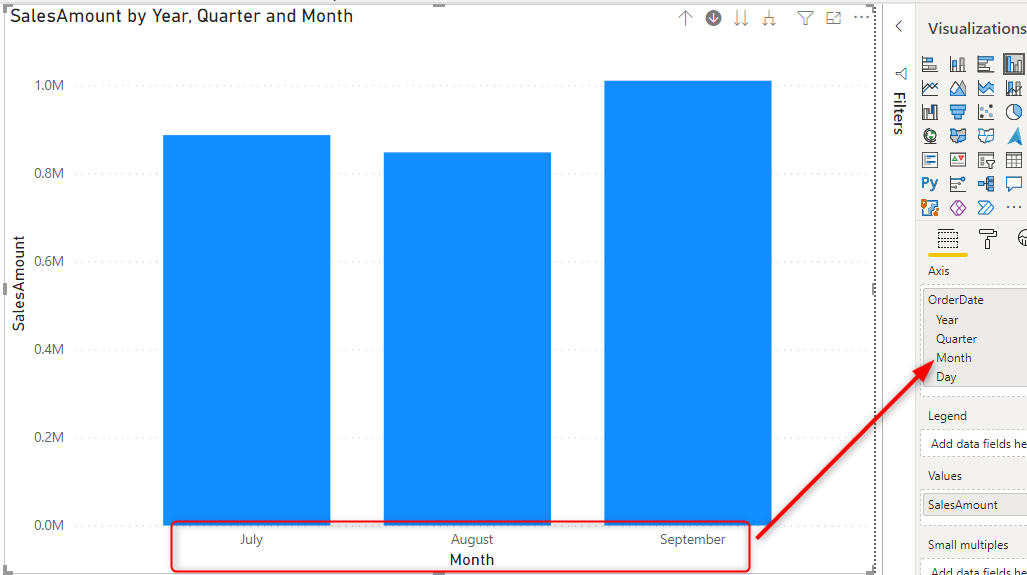
If you click on a quarter, then you will see the visual drills down to the months of that quarter;
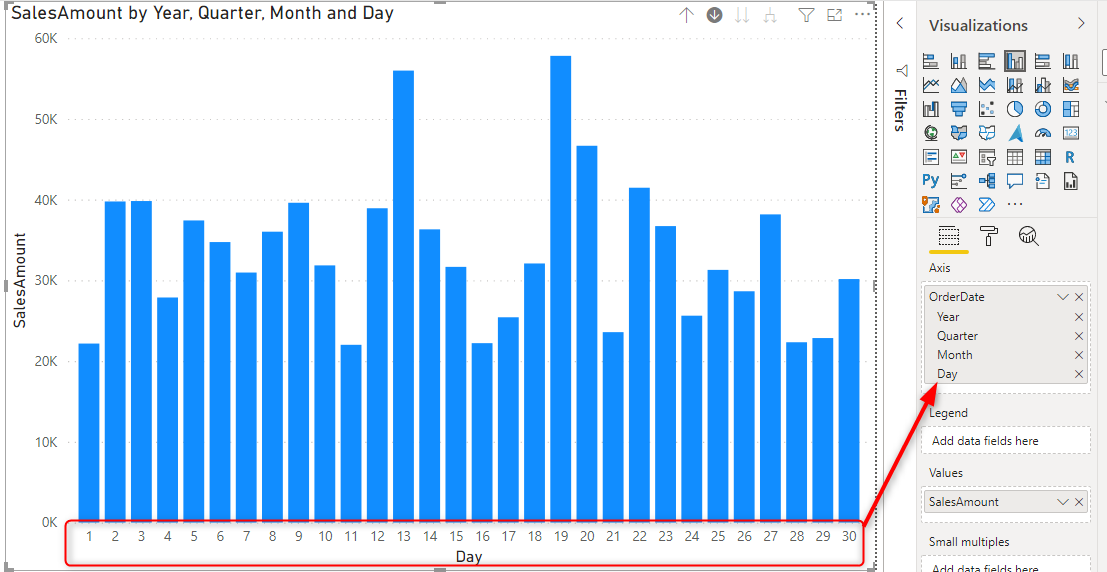
This action will traverse the levels of the hierarchy until the lowest level for as long as you click on a column. You are selectively drilling down to specific data sections.
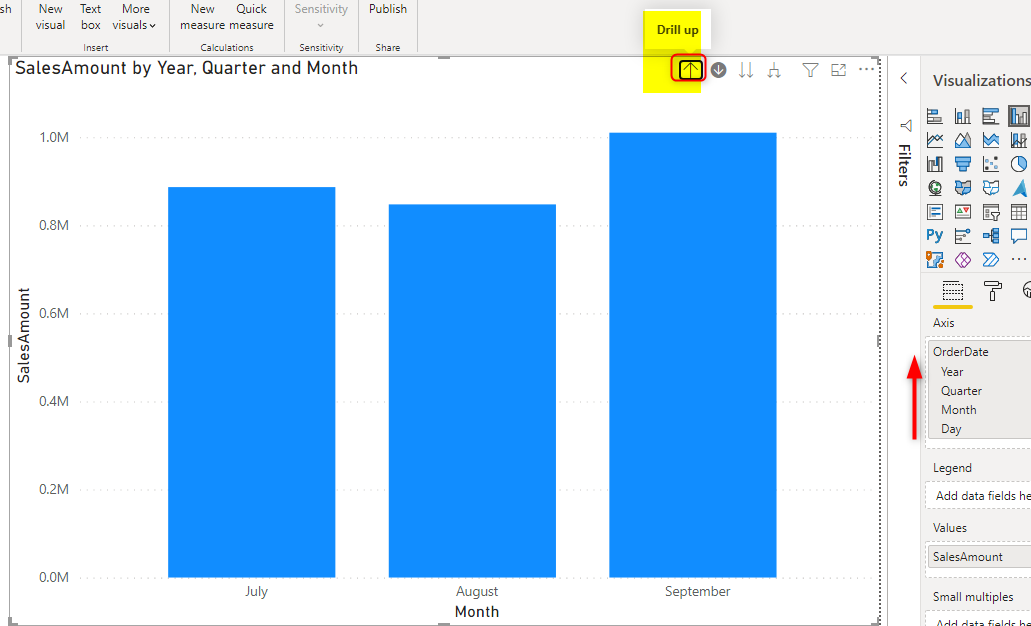
If we use the Drill Up button (the single arrow up) then we go one level up in the hierarchy;
This ability to selectively drill down and drill up to areas you want is a fantastic data exploration technique. This can be used to find anomalies in the data and going and investigating that area more in detail.
The selective drill-down is possible as long as you have the drill mode as ON. Make sure to turn it OFF when you have finished the data exploration.
There is a small problem in the selective drill down, and that is; if you are in a lower level, you don’t know which higher level you are in. for example, when you are in days, you don’t know that what month these days belong too. There is a simple workaround to get this fixed, which I explained that in my other article here;
All-in-one drill down: Seeing the trend
Another way to drill down is to drill down to the second level of the hierarchy, but not just for the selected year. You may want to see throughout all years how the sales changes, but you want to see that in quarter level. Meaning you want to see all years and their quarters in the X-Axis. The selective drill down doesn’t give you this option. To achieve this, you can use the fork-like button.
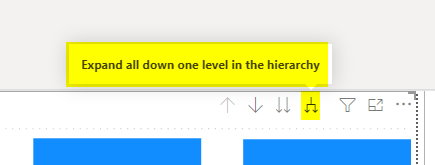
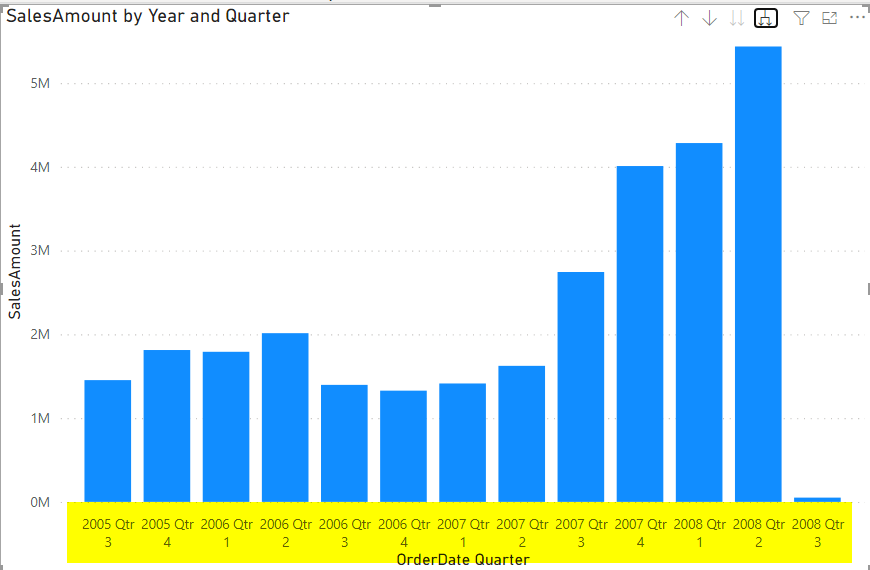
If you are practising with the sample file, ensure to first drill all the way up to the year level and turn off the drill mode from the previous practice. Then you can click on the Expand all down one level in the hierarchy. this immediately changes your X-Axis to include both year and quarter for all year.
another expansion all down one level will bring also month to the X-Axis besides the year and quarter
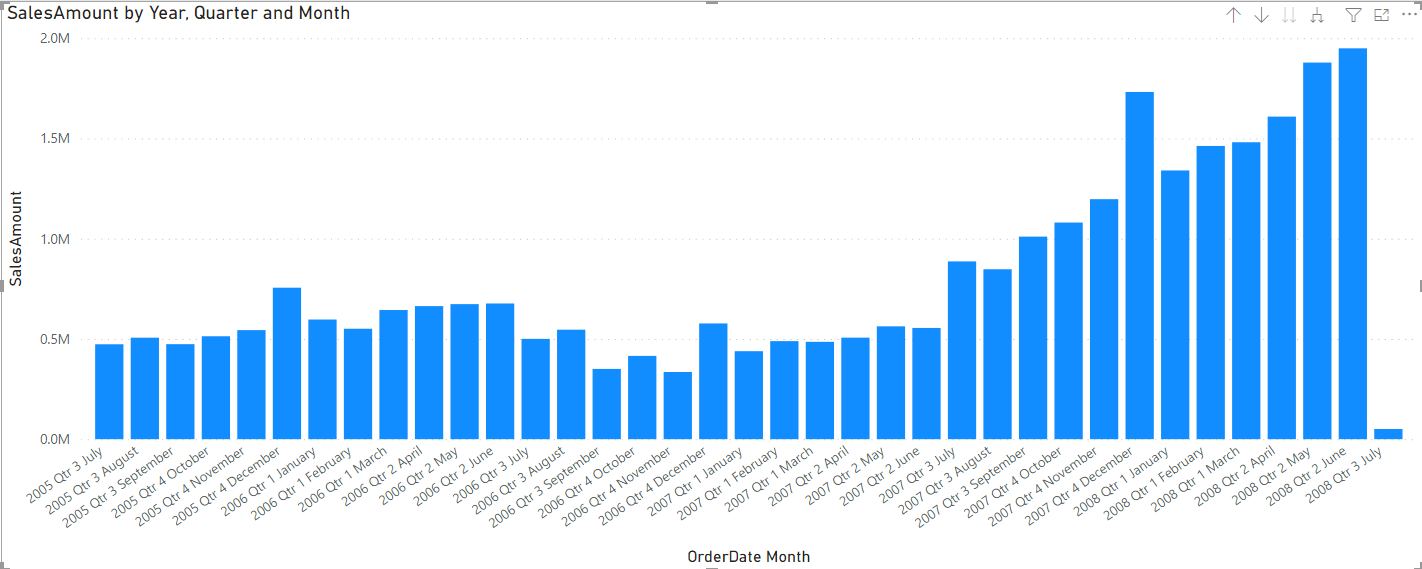
This is an amazing way to see the trend. As you can see, we can see the trend through the years and months all in one view. This is not selective data exploration, instead, it is a good way to see the trend of changes in the value.
You can use the same drill up button to go up.
Next-level Branching; regardless of the higher level
The third method of drill-down is more like a branching than a drill down. Drill up again to the highest level before practising this sample. Let’s say you are interested to see which quarter is best-seller and which quarter is worst. You don’t care about the year, you want to do this analysis for all years but at the quarter level. You can of course achieve this by creating a visual which has SalesAmount as the Value, and Quarter as the X-Axis. However, you can do the same using a drill-down option here called; Go to the next level in the hierarchy. This is a two-arrow-down button.
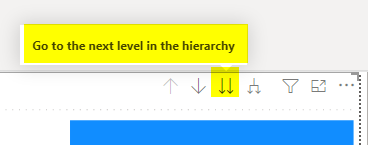
When you click on this button, the visual shows you quarters (assuming that you were on the year-level before this).
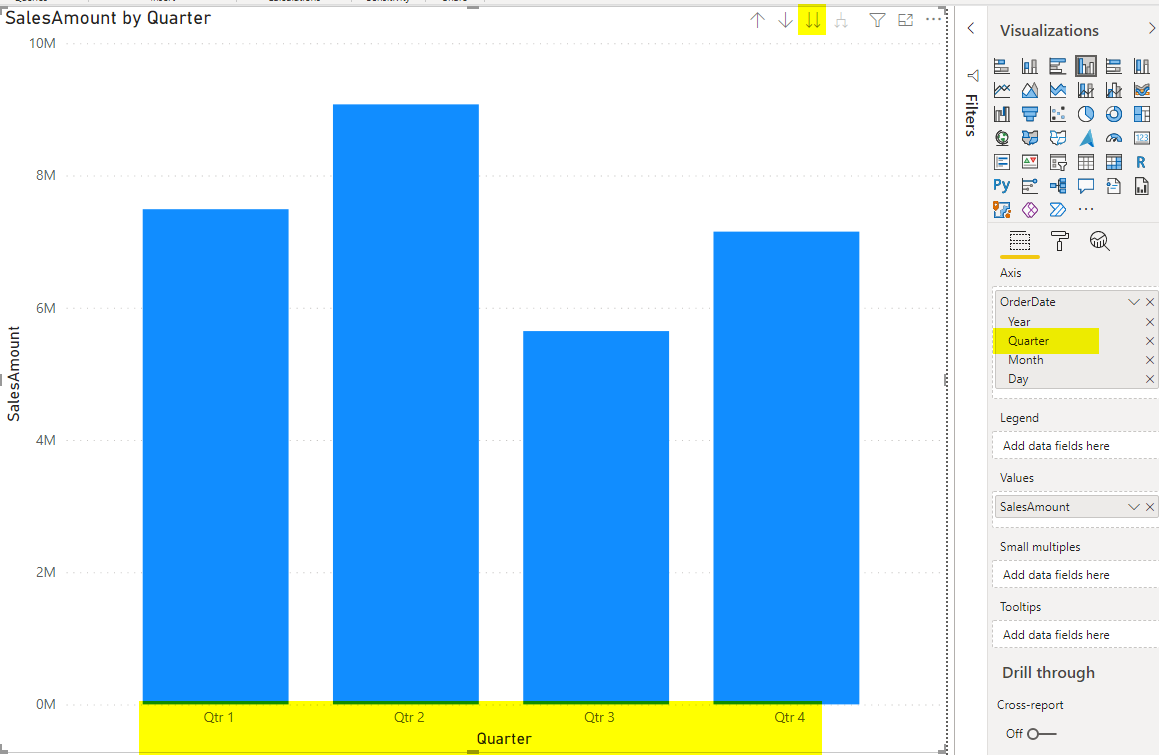
The quarters above are not for a particular year. They are the accumulation (or whatever the default summarization of the value field is) of the SalesAmount for all years. It looks like you created a new visual which only has the quarter in the X-Axis regardless of the year or higher levels of the hierarchy. This is a great way to see quarter 2 is the best-seller and quarter 3 is the worst.
If you do this action once again, this time you see the analysis on a monthly basis. Again this is regardless of year or quarter.
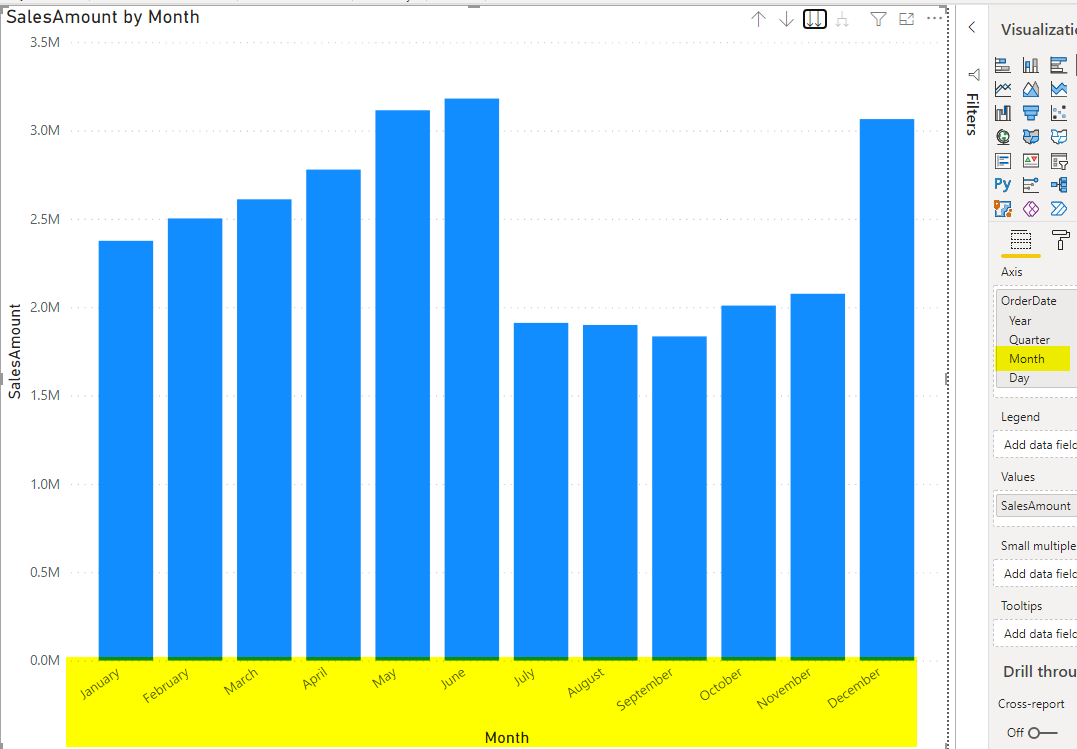
This is a great way to compare values in another level of hierarchy regardless of the higher levels. That is why I call this branching than drill down. You can use the same drill up button to go back to the higher levels.
Drill down setting is persistent
A question that I often get after explaining these in my courses is that: “If we apply any changes like above, and then publish the report, does it keep our changes, and users will see it at that view?” The answer is yes. The drill-down setting is persistent. If you drill down to the month level and publish your report, the default view of your report will show the visual at the month level. However, users can change it for themselves.
Drill down/up is an end-user option
A very critical understanding is that the drill-down/up options are not developer-only features. End-users can also change it. And It would be very helpful for them to do it. This means for every data exploration they don’t need to come to you as a developer and ask for it to be implemented, they can do it all themselves.
Because the drill-down options are doing totally different actions, I strongly recommend that you include that in your end-user training and ensure they all understand how those options work.
Drill down/up menu available elsewhere
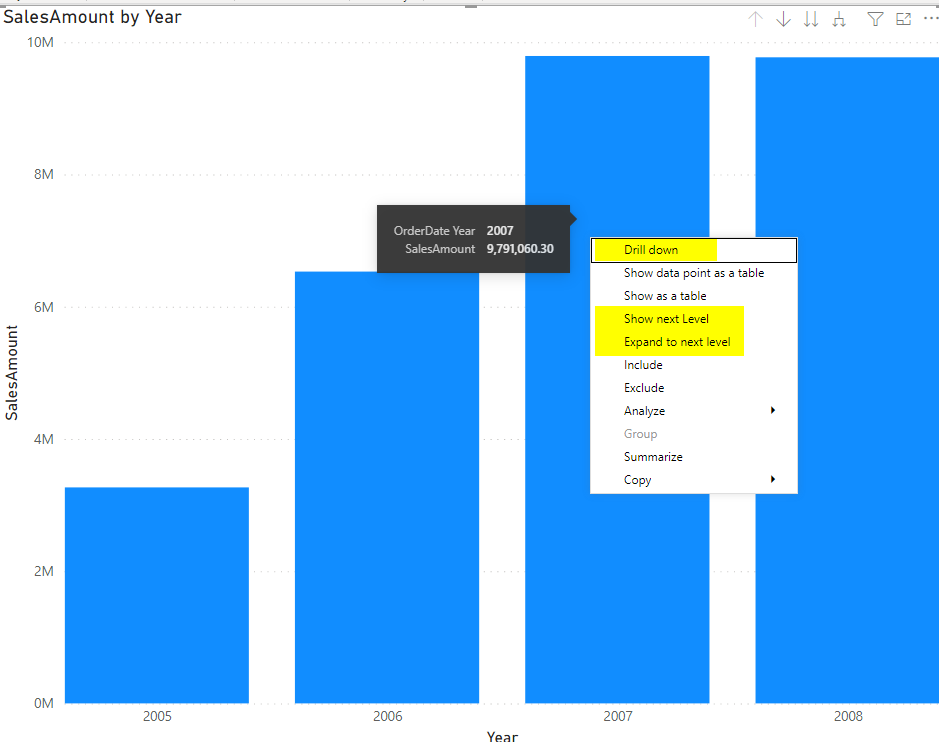
Drill down/up is not available only through those buttons I explained here. They are also available when you right-click on a column (or bar, or data point) in the chart;
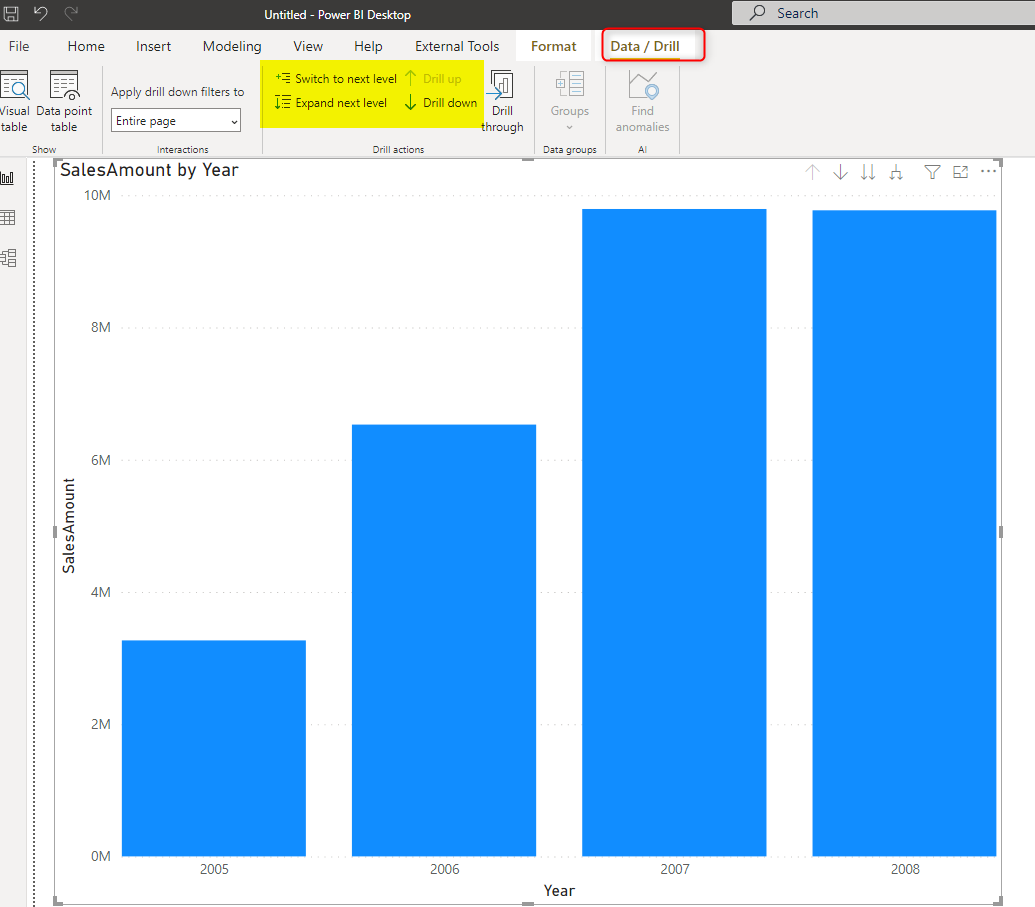
They are also available in Power BI Desktop under the Data / Drill menu option;
Drill-through is different
You may have seen options for drill-through and may think that is the same. Drill-through is another way to drill down from a higher-level view of the dashboard to a lower-level view of the detailed visualization. This type of analysis can be done differently using drill-through, which I explained it in detail here;
Summary
Power BI has a good range of drill-down and up options, which can be helpful in data exploration, analyzing the trend, and branching. In this article and video, I explained how these options are working. The important tip to consider is that the drill-down and up are end-user options, you have to ensure that you included that in your end-user training to avoid their confusion.
Download
Download the sample file to practice from here.


Reza is author of more than 14 books on Microsoft Business Intelligence, most of these books are published under Power BI category. Among these are books such as Power BI DAX Simplified, Pro Power BI Architecture, Power BI from Rookie to Rock Star, Power Query books series, Row-Level Security in Power BI and etc.
He is an International Speaker in Microsoft Ignite, Microsoft Business Applications Summit, Data Insight Summit, PASS Summit, SQL Saturday and SQL user groups. And He is a Microsoft Certified Trainer.
Reza’s passion is to help you find the best data solution, he is Data enthusiast.
His articles on different aspects of technologies, especially on MS BI, can be found on his blog: https://radacad.com/blog.
This was really done well!
Thanks for your comment 🙂