

The conditional formatting can be used in many visuals in Power BI, and I have explained an example of doing it in table visual. This feature is also available in the Card Visual in Power BI, However, I have seen a very few people using it. In this short blog article, I’ll explain how this feature works. If you want to learn about Power BI, read Power BI book from Rookie to Rock Star.
Card Visual
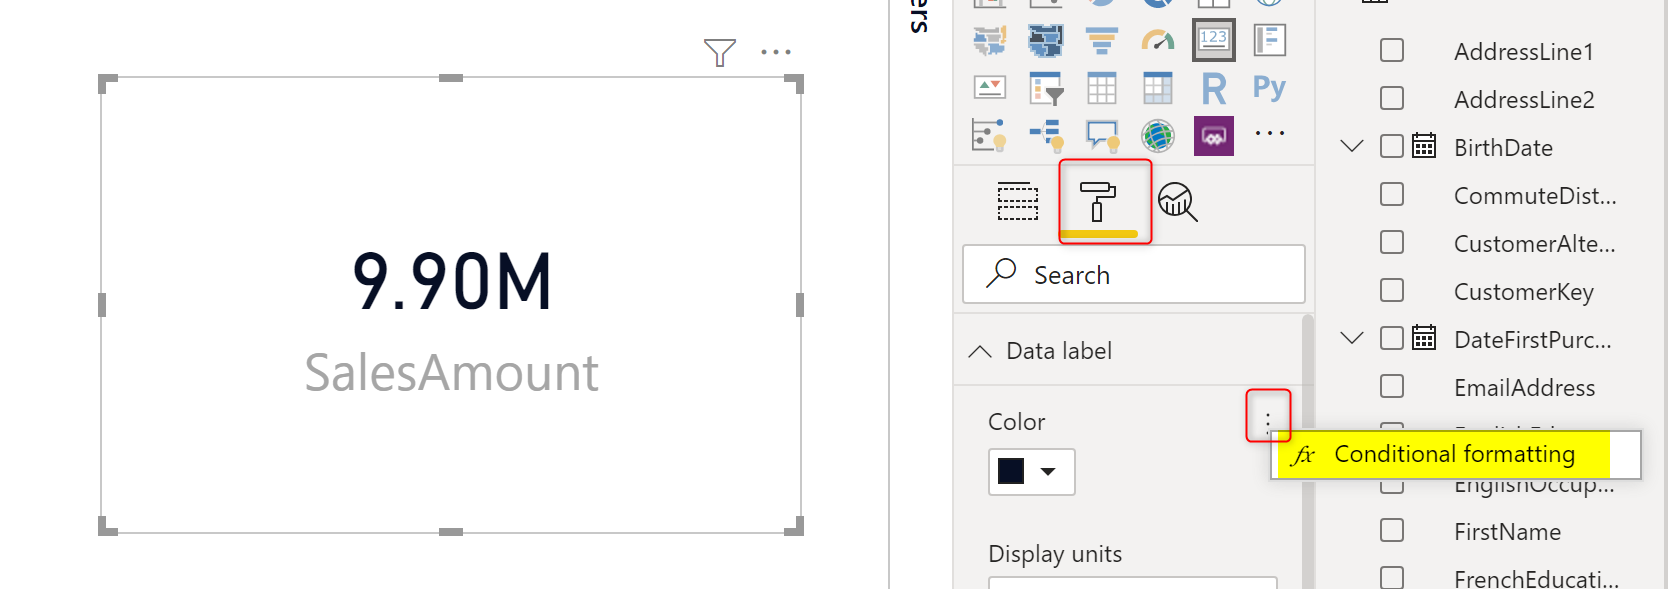
The default Card visual in Power BI is a great visual to show you one single value; text, date, or number. Below is an example of a Sales Amount value visualized in a Card Visual:
The visual above shows the Sales Amount for every English Education category. However, the value is always the same colour. Let’s say you want to do conditional formatting in the visual and say if the value is less than $5M, between $5M and $8M, and more than $8M. Let’s see how you can do that with conditional formatting.
Conditional Formatting in the Card Visual
Finding the conditional formatting in the card visual is a bit tricky. there is no separate option for that. You need to go to the Format tab of the visual, and then expand the Data Label. the right beside the Data Label’s colour you need to hover your mouse, and you will find a three dots icon appearing, which if you click on it, you will see Conditional Formatting.
Now in the Conditional Formatting tab, you can apply it in different methods. for example, you can choose Rules, and then
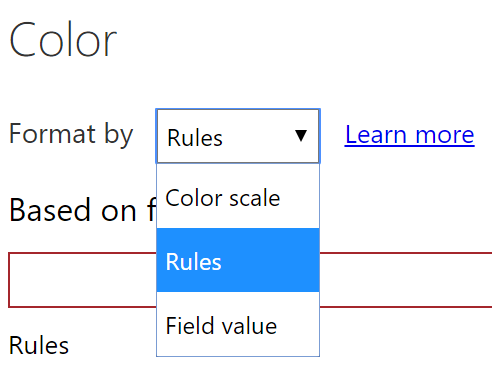
The Rules mode will give you the ability to put custom roles as below;
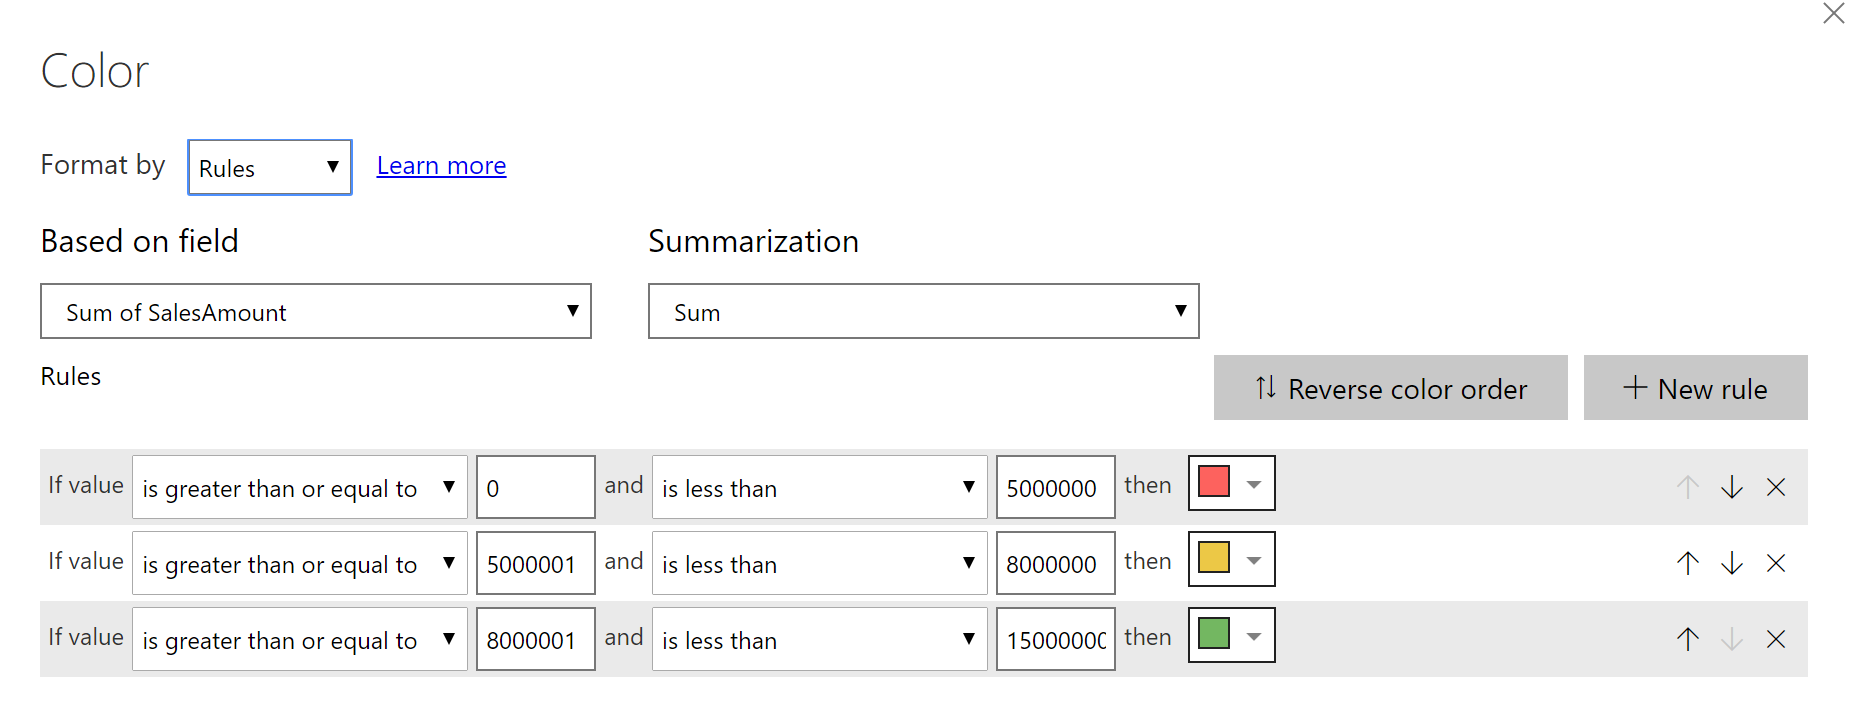
You might ask; what if I want to define rules dynamically and compare it with other values. In those cases, I suggest using the Format by “Fixed Value” which you can select a Measure. I have explained in this article in details how you can do custom dynamic formatting using Fixed Value and Measures.
Result
Here is the result now

Conditional Formatting everywhere
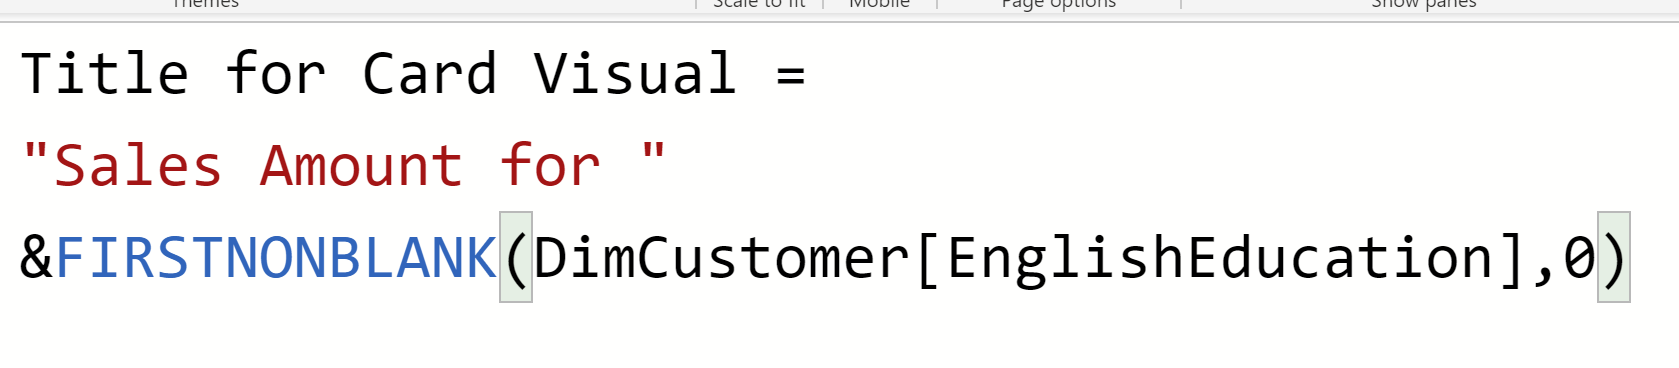
Conditional formatting is not just for colours. You can even use it for the title of card visual too. You can build titles such as Sales Amount of the High School category etc. For that, I created a measure to create a concatenated label:
Title for Card Visual =
"Sales Amount for "
&FIRSTNONBLANK(DimCustomer[EnglishEducation],0)
And then this can be used as Format by Fixed Value, and set the format by this measure above.
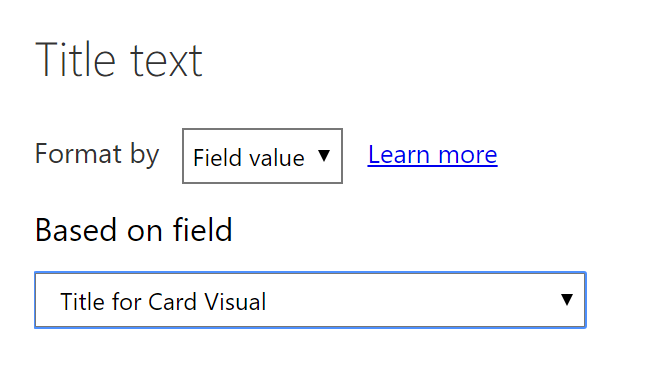
And now in addition to the colour changes, we also have the title change:
Summary
Conditional Formatting is your superpower in the visualization. Always consider doing that. In this short article, you learned how easy and quick is to create a card visual with conditional formatting. If you are interested to learn more about conditional formatting check the below articles:
- Show Me the Biggest Number! Conditional Formatting in Power BI
- DAX and Conditional Formatting Better Together: Find The Biggest and Smallest Numbers in the Column


Reza is author of more than 14 books on Microsoft Business Intelligence, most of these books are published under Power BI category. Among these are books such as Power BI DAX Simplified, Pro Power BI Architecture, Power BI from Rookie to Rock Star, Power Query books series, Row-Level Security in Power BI and etc.
He is an International Speaker in Microsoft Ignite, Microsoft Business Applications Summit, Data Insight Summit, PASS Summit, SQL Saturday and SQL user groups. And He is a Microsoft Certified Trainer.
Reza’s passion is to help you find the best data solution, he is Data enthusiast.
His articles on different aspects of technologies, especially on MS BI, can be found on his blog: https://radacad.com/blog.
This is awesome and very handy, Thank you for sharing!
Glad you liked it.
Awesome thank you, this solved my problem.
Thanks again.