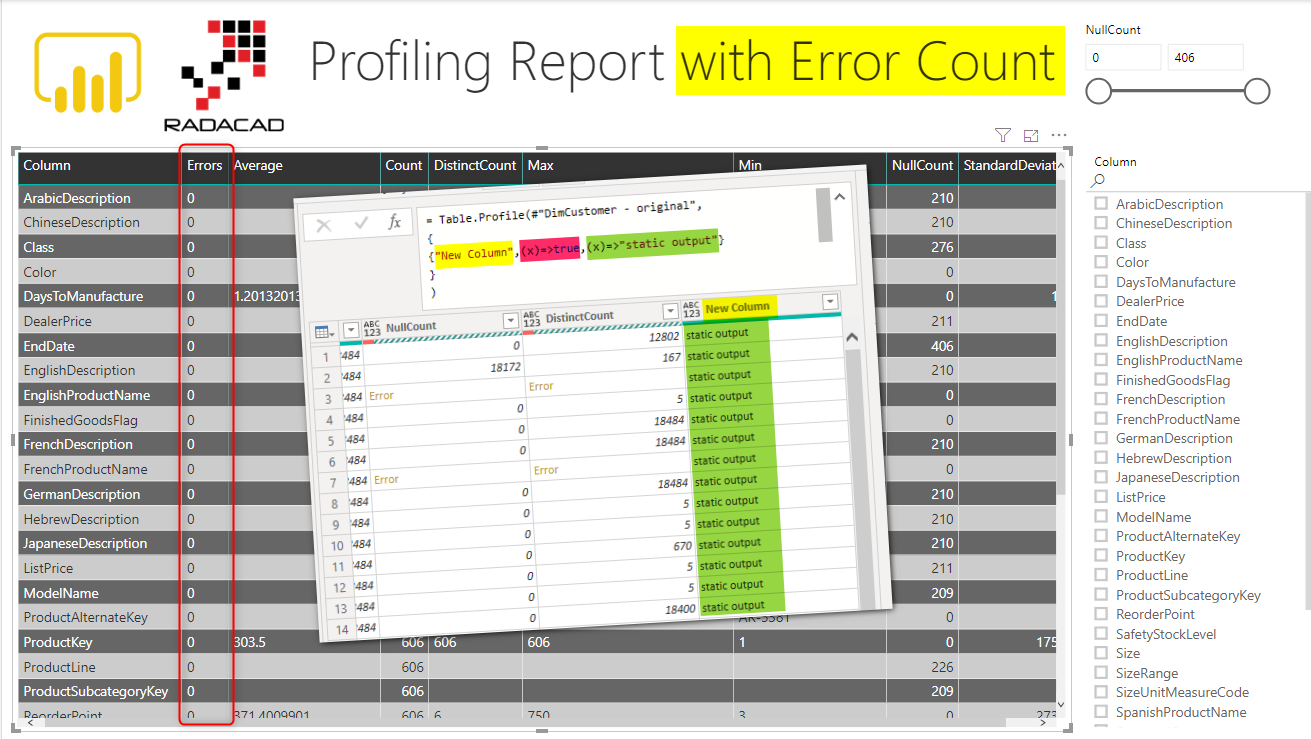
I have explained previously how you can use the Table.Profile Power Query function to fetch the profiling data of a table, such as minimum value, maximum value, null count etc, and use it in a report page to inform the user about the quality of the data. However, that function doesn’t provide you with one important information: The count of error values in each column. Although, I have explained another method of catching error rows, It is also helpful if the profiling report can also have error’s information in it. So in this article, I am explaining how to add count of errors to the Table.Profile function in Power Query. If you want to learn more about Power BI, read Power BI book from Rookie to Rock Star.
What is Data Profiling
As you might not have read my previous article about data profiling in Power BI, I explain it very briefly here again. Data profiling is the process of understanding more about the data. Any information that can help to understand the data would be helpful. For example, you probably like to know how many unique values you have in the column, what is the minimum values, what is the maximum, the average, standard deviation and etc. This is what Data Profiling will provide for you. I strongly recommend you to read this article as a prerequisite to learn how Table.Profile function in Power Query helps you to get profiling information on columns of a table:
Table.Profile Missing the Count of Errors
The default output of Table.Profile function in Power Query is missing the count of errors for a column. Something that you can see in the column statistics in the Power Query editor anyways!
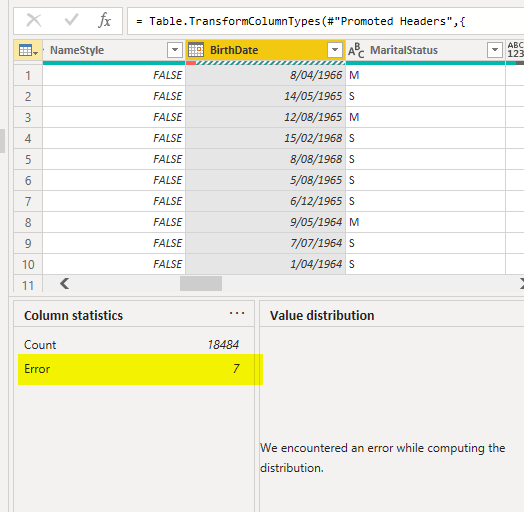
Now let me show you how you can fetch the count of errors with this function.
Using the second Parameter of Table.Profile to Fetch more information about the column
If Table.Profile function is used by default, only provides specific information, such as max, min, count, etc. If you want more information, then you can get it, but you need to write your own function for it. I have explained fully in details what is a custom function in Power BI, and also a sample of how to create it using M (Power Query Formula Language) script. Here is how the second parameter can be used:
Table.Profile(table as table, optional additionalAggregates as nullable list)
The additionalAggregates that you see in the above syntax definition is an optional parameter, which is a list data type. This is a list that is going to have a function in each item. Each function, should have a name, a true or false logic in which the function returns a value, and the function itself. something like this:
- Function Name
- The true or false logic in which the function would return the result (if true), or returns null (if false)
- The function itself
The above three items should be in a list itself. So we are dealing with a list inside a list. I highly recommend you to read my articles about the basics of Power Query scripting part 1 and part 2 to understand more about this part.
To define a list, we use {}. and if you want to have a list under a list, it would be: { {}, {}, … }
Each of the inside {} is representing a function and would return a column as the result of Table.Profile function. Here is a simple example:
= Table.Profile(#"DimCustomer - original",
{
{"New Column",(x)=>true,(x)=>"static output"}
}
)
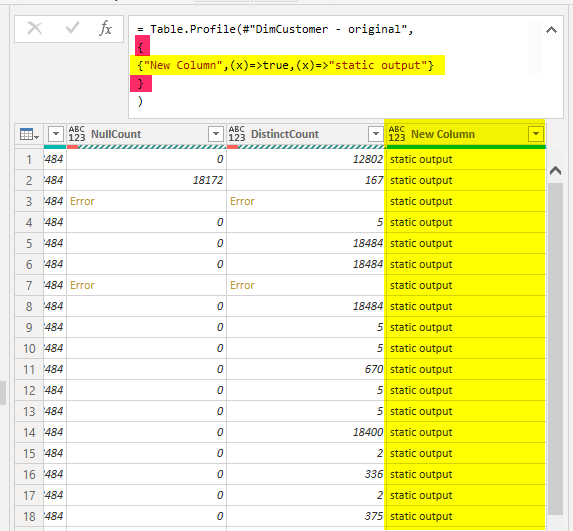
Let me explain what happened in a more detailed explanation. The Table.Profile function is getting the table as the first input, then the second input is a list {} which is highlighted red in the above screenshot. inside that list, we have another list {}, which is highlighted yellow. That list includes the three information I mentioned earlier: function name, the return logic, the function to return the value. The highlighted screenshot below shows how each part is related to building the output.
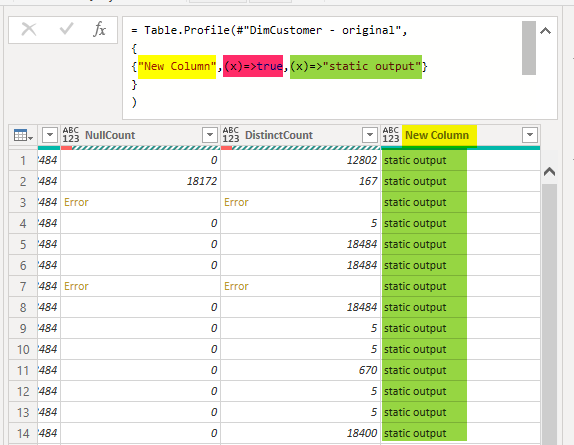
I have used the above simple example to show a static output. If you want to learn how an actual function is built-in Power Query, read my article here. Because that is how the second and the third item in the list above are created.
The Function to Fetch Error Count
Now that you know how to add a column using a function to the Table.Profile column, all you need is a function that returns the count of errors.
The input of this function is always the current column that the Table.Profile is working on, and all the values of that column as a list. I just showed the input parameter itself, and you can see the result.
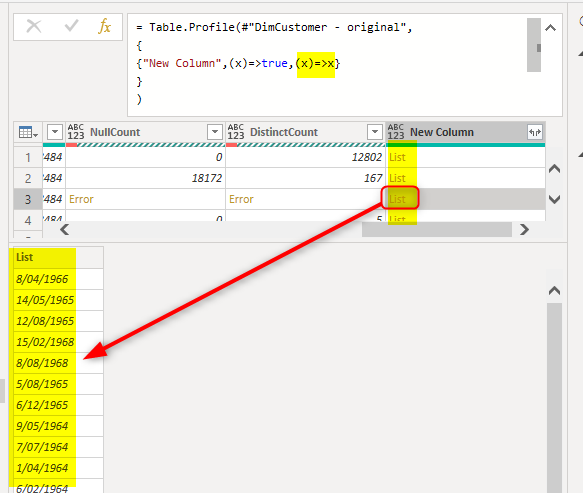
Now, it is up to you how to write the function to fetch error values, here is one way of doing it:
(x)=>
Table.RowCount(
Table.SelectRowsWithErrors(
Table.FromValue(x)
)
)
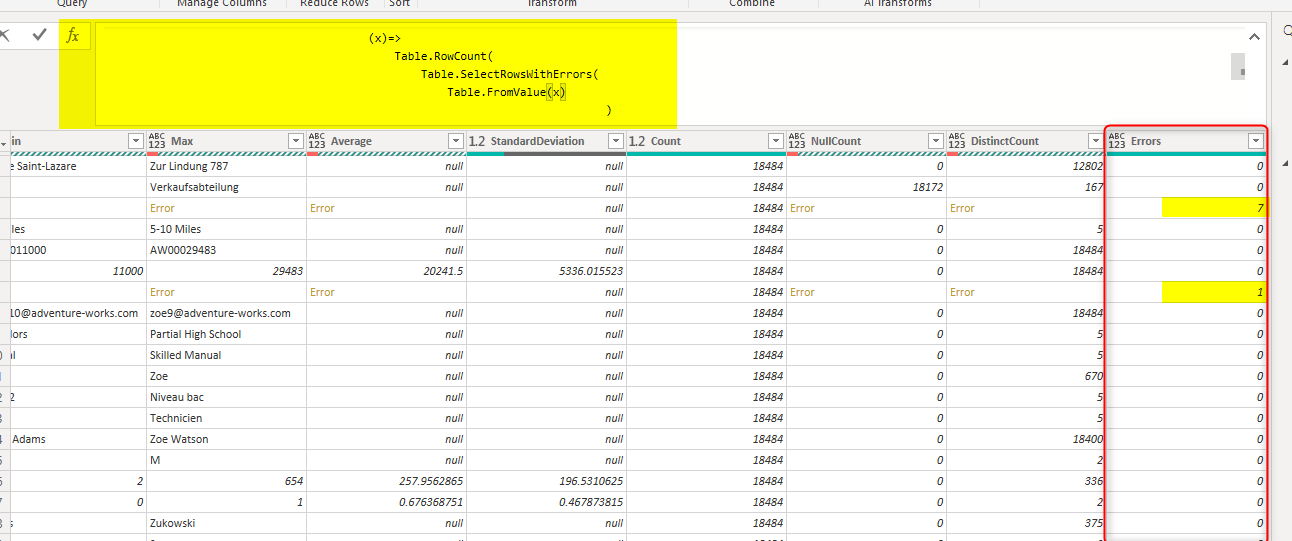
The function above, first convert the list to the table, then select only error rows, and then count the number of rows for that as the value to return.
and this is where the function should be used:

I have created a column named Errors, and it returns the count of errors as below. the entire M script for this query is as below:
let
    Source = Table.Profile(#"DimCustomer - original",
                                {
                                    {
                                        "Errors",
                                        (x)=>true,
                                        (x)=>
                                            Table.RowCount(
                                                Table.SelectRowsWithErrors(
                                                    Table.FromValue(x)
                                                                            )
                                                            )
                                    }
                                }
                            )
in
    Source
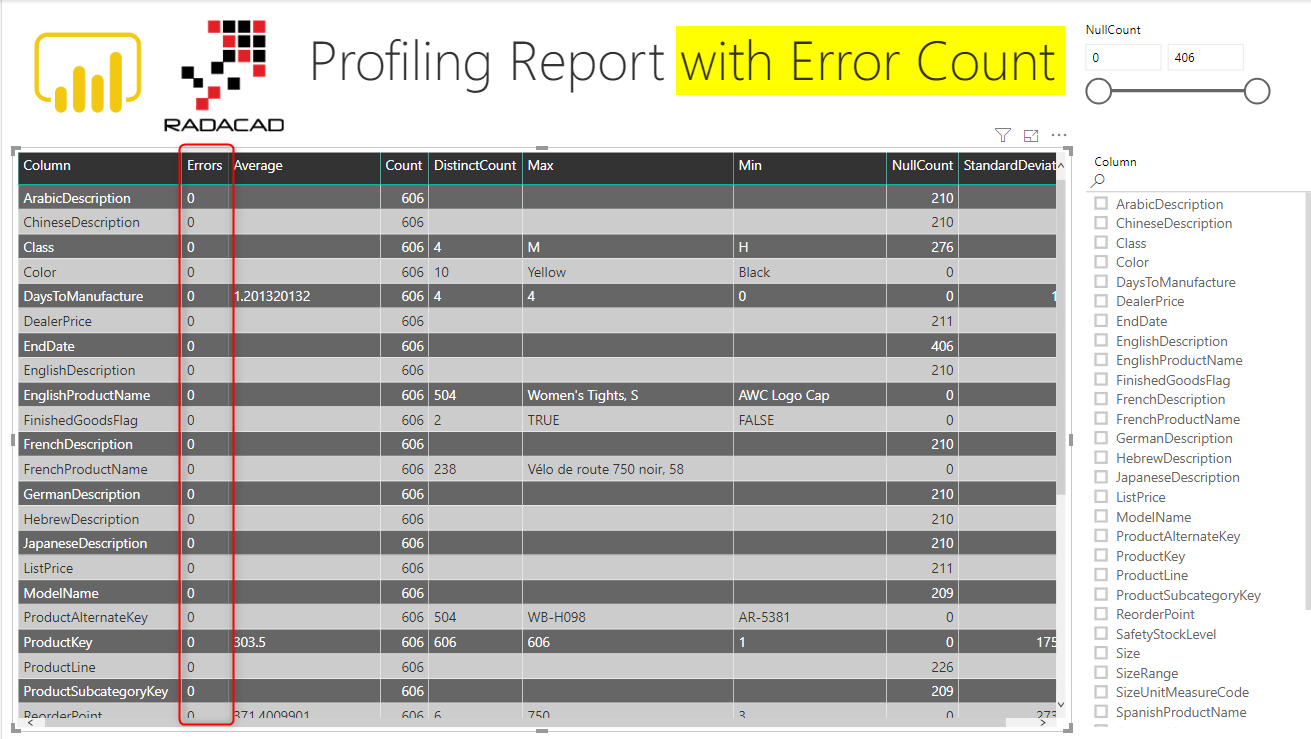
Using the result of this query, now I can get my profiling report even better:
Summary
The second argument of Table.Profile function is helpful in doing any customization you want, even changing the way that min, max or other aggregations are calculated. You just need to write your custom function for it. In this article, you have seen an example of a custom function to fetch the count of errors. Special thanks to Curt from Power Query team for his help on pointing me in the right direction wherever needed.



Very useful, thanks!
??