
In this post I am going to show how to create a polar chart using R codes inside Power BI.
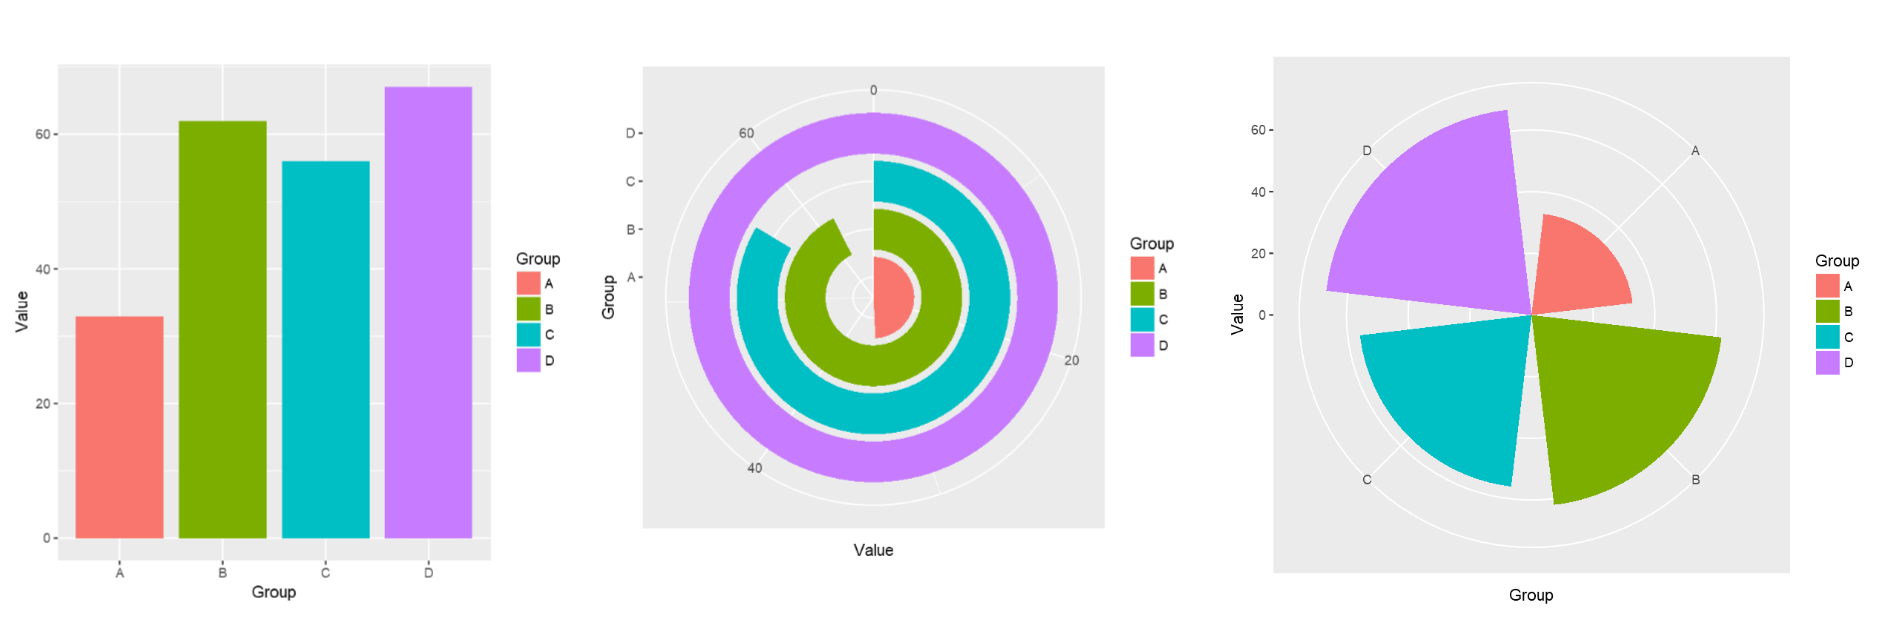
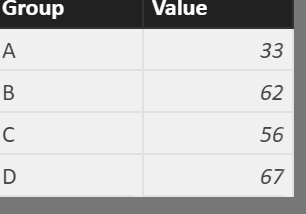
imagin that we have below dataset about 4 main groups and their related values.
I am going to show you how to draw different polar charts with different shapes.
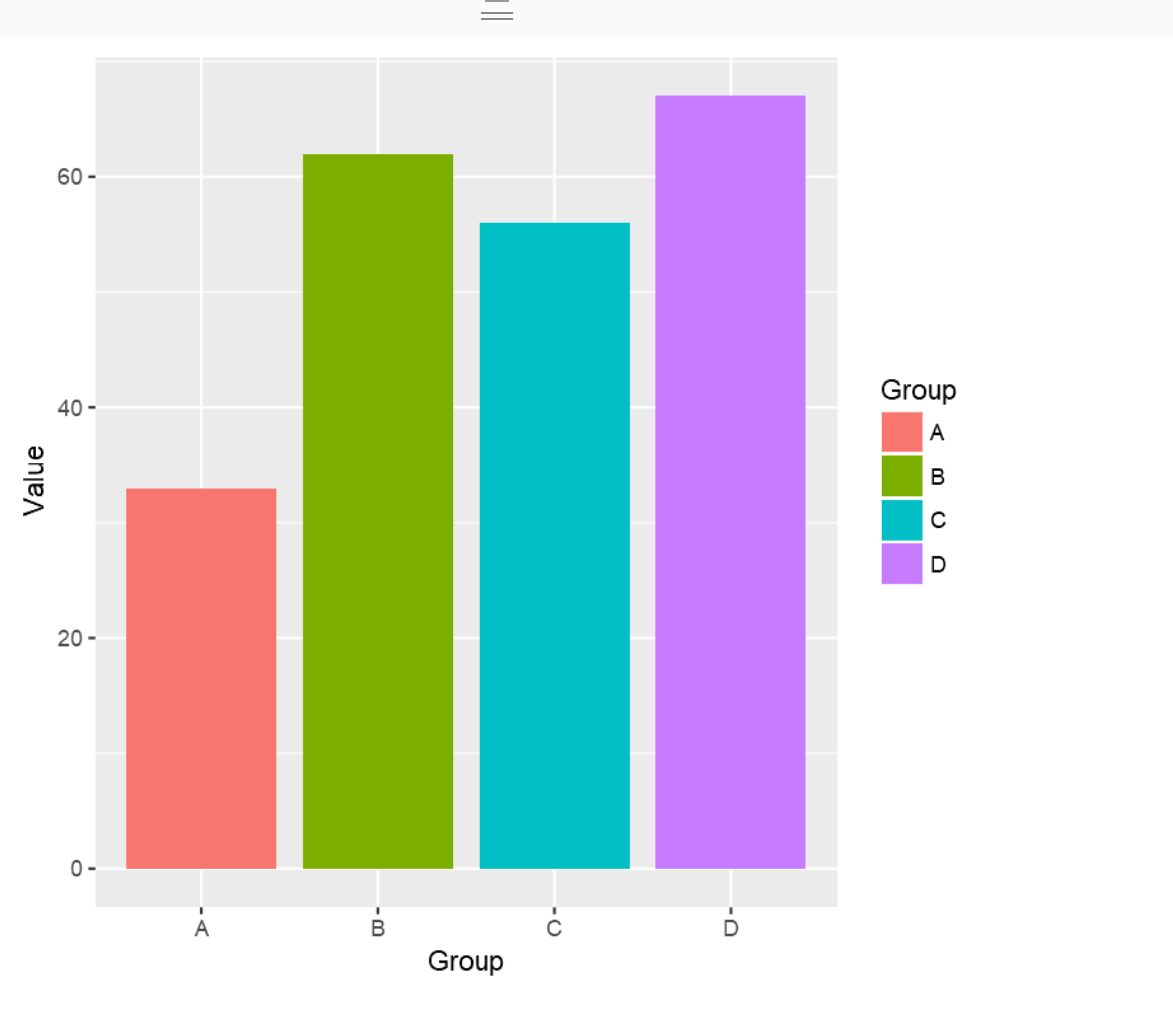
imagin that we have a bar chart created from below codes, first, I am using “ggplo2” package for this aim.Next, in aes function , x axis will have the group name, y axis will have the value of each group, and the fill color has the group name. then I used geom_bar function to draw a simple bar chart
library(ggplot2)
ggplot(dataset, aes(x = Group, y = Value ,fill = Group )) +
  geom_bar(width = 0.85, stat="identity")
the result of running the code in Power BI is below chart:
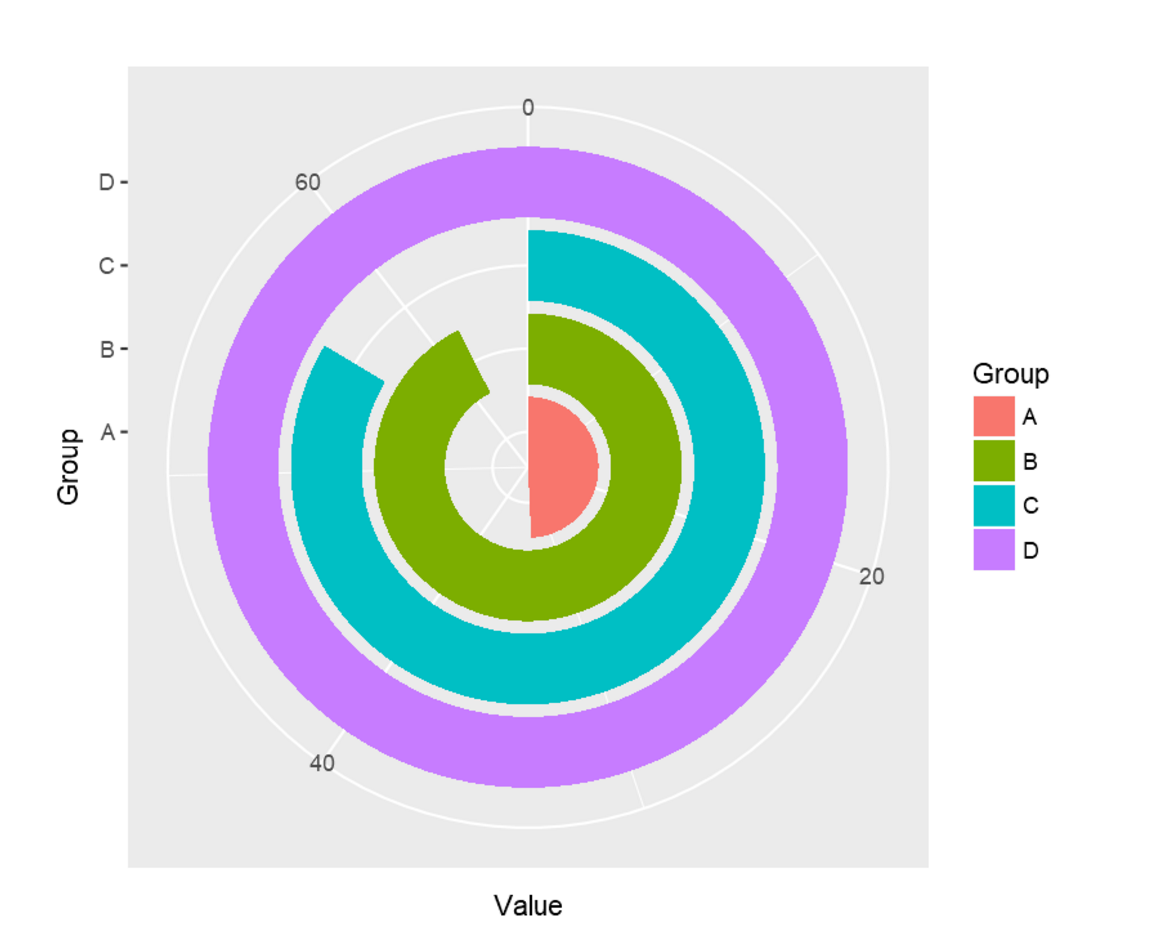
Now, I am going to change the chart into a simple polar chart, first based on Y axis value then based on x axis value.
y-axis polar chart
library(ggplot2)
ggplot(dataset, aes(x = Group, y = Value ,fill = Group )) +
  geom_bar(width = 0.85, stat="identity")+coord_polar(theta = "y")
I just add a layer to the above furmula “coord_polar()” this function also has been used for creating pie charts. it gets the “theta” variable, in below example I put theta=y axis, so we have below charts
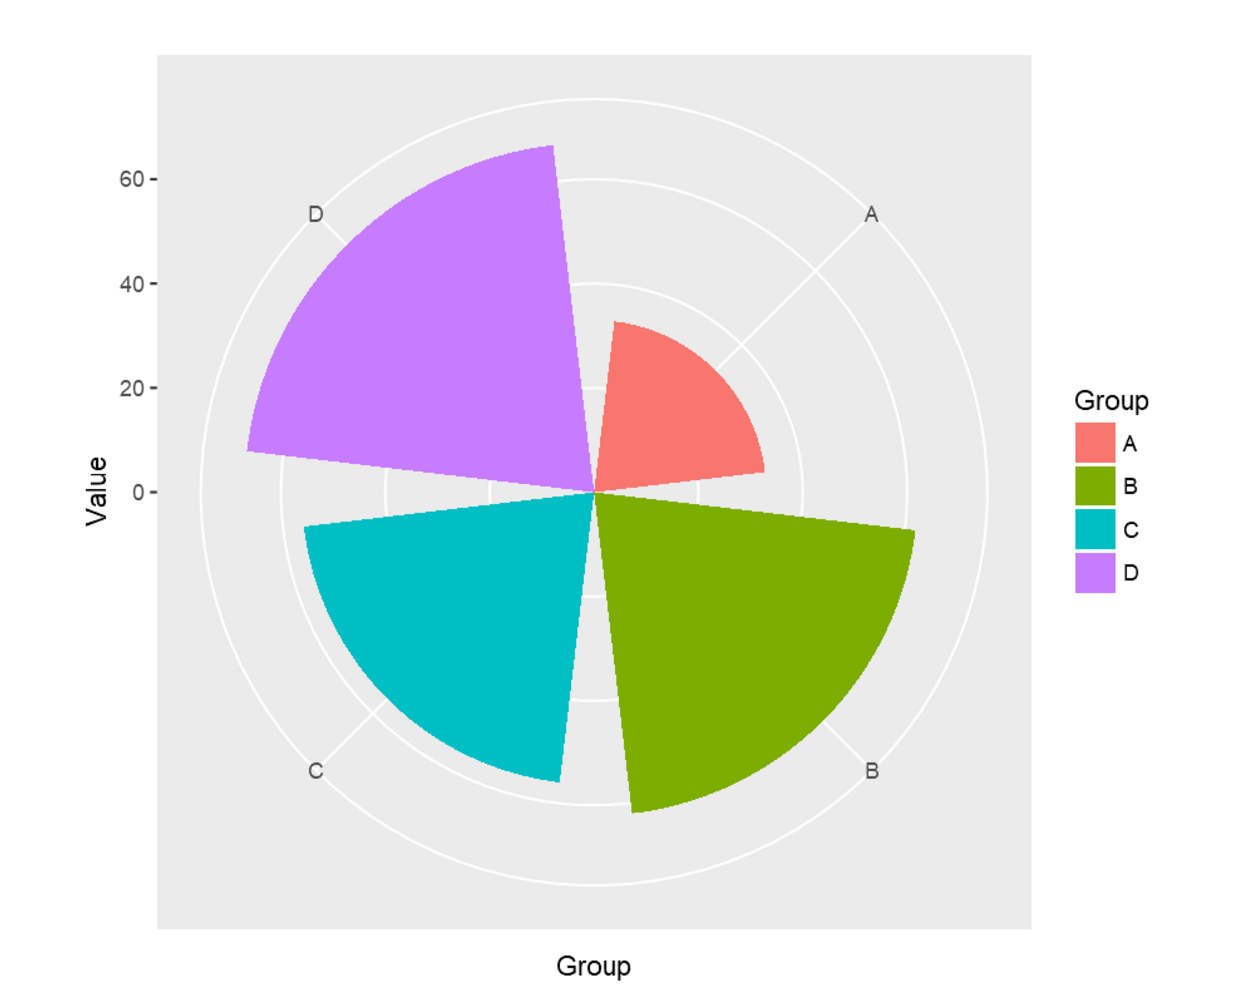
X- axis Value
I able also to change the theta varibale to x axis to have a chart based on x,
I wrote below codes
library(ggplot2)
ggplot(dataset, aes(x = Group, y = Value ,fill = Group )) +
  geom_bar(width = 0.85, stat="identity")+coord_polar(theta = "x")
the result of runig the above code would be below chart, as you see the bar chart has been change to a polar bar chart.
Redffrence :http://ggplot2.tidyverse.org/reference/coord_polar.html


