
I have explained the main concept behind the Clustering algorithm in Post 5 and also I have explained how to do cluster analysis in Power BI in Part 6.
In this post, I will explain how identify the best number of cluster for doing cluster analysis by looking on the “elbow chart”
K-Mean clusters the data into k clusters. we need some way to identify whether we using the right number of clusters.
elbow method is a way to validate the number of clusters to get higher performance. The idea of the elbow method is to run k-means clustering on the dataset for a range of K values.
The min concepts is to minimize the “sum of squared errors (SSE)” that is the distance of each object with the mean of each cluster. we try k from 1 to the number of observation and test the SSE.
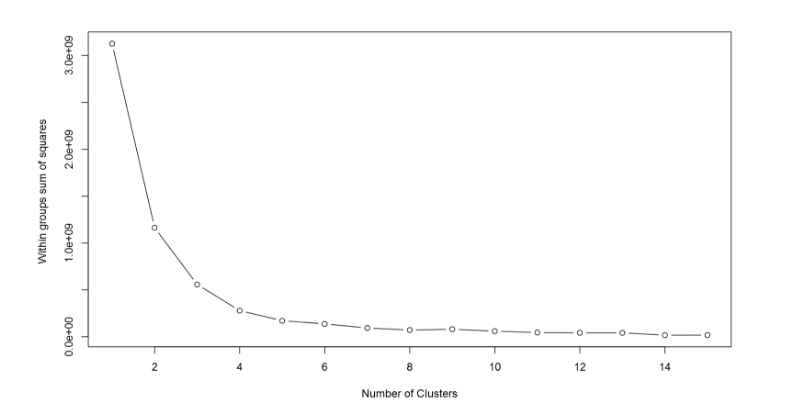
Let’s have a look on a “Elbow Chart”.
as you can see in above picture, In Y axis we have SSE that is the distance of objects from the cluster mean. smaller SSE means that we have better cluster (see post part 5).
so as the number of cluster increase in X axis, SSE become smaller. But we need minimum number of cluster with the minimum SSE, so in above example, we choose the elbow of chart to ha.ve both minimum number of cluster and minimum SSE.
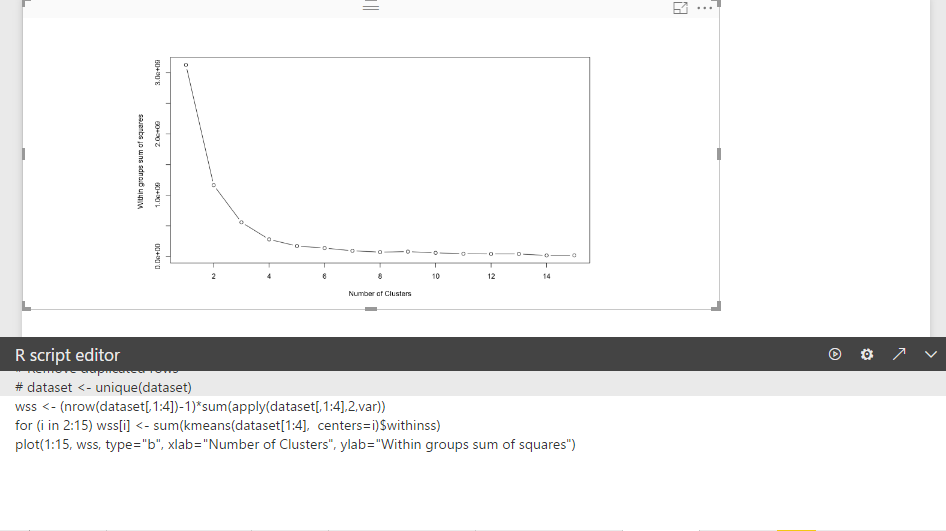
So, Back to example I have done in post part 6, I am going to show how to have Elbow chart in Power BI using R codes.
wss <- (nrow(dataset[,1:4])-1)*sum(apply(dataset[,1:4],2,var))
for (i in 2:15) wss[i] <- sum(kmeans(dataset[1:4], centers=i)$withinss)
plot(1:15, wss, type=”b”, xlab=”Number of Clusters”, ylab=”Within groups sum of squares”)
I write this code inside Power BI R editor visualization.
According to the explanation, for clustering Fitbit data we need 4 or 3 cluster. which is minimum SSE and minimum number of Cluster. by applying this number, w should have better clustering.
You able to download the power BI file for cluster analysis and evaluation from below
Download Demo File
[1]https://stats.stackexchange.com/questions/147741/k-means-clustering-why-sum-of-squared-errors-why-k-medoids-not


This tool is already amazing – r over and above that is nothing less than magic – sample file is very helpful. I feel like a kid in a candy store. Many thanks.
Thanks so much!
Thank you so much.