In the previous article, I have explained what is the key influencers visual and how it works. Later the count and impact have been explained in the other Post.
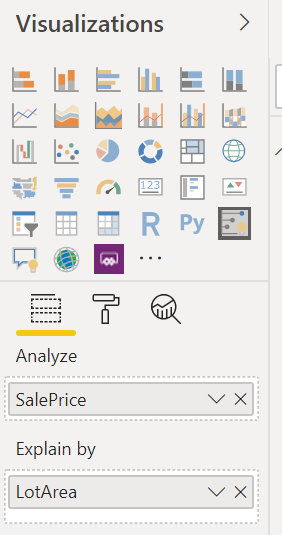
Initially, Key Influencers visual just has two data fields:
Analyze and Explained by
the Analyze fields, analyse the data based on row by row, so no aggregation on data. for instance, in the above example, for identifying what factors impact on the house sale price, we analyze it by house years build, overall quality of the house and lot area of the house.
this visual will answer below question:
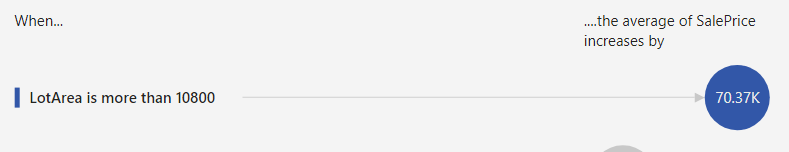
Which fields, LotArea, Overall Quality and Year Built, has more influence on House Sales Price?
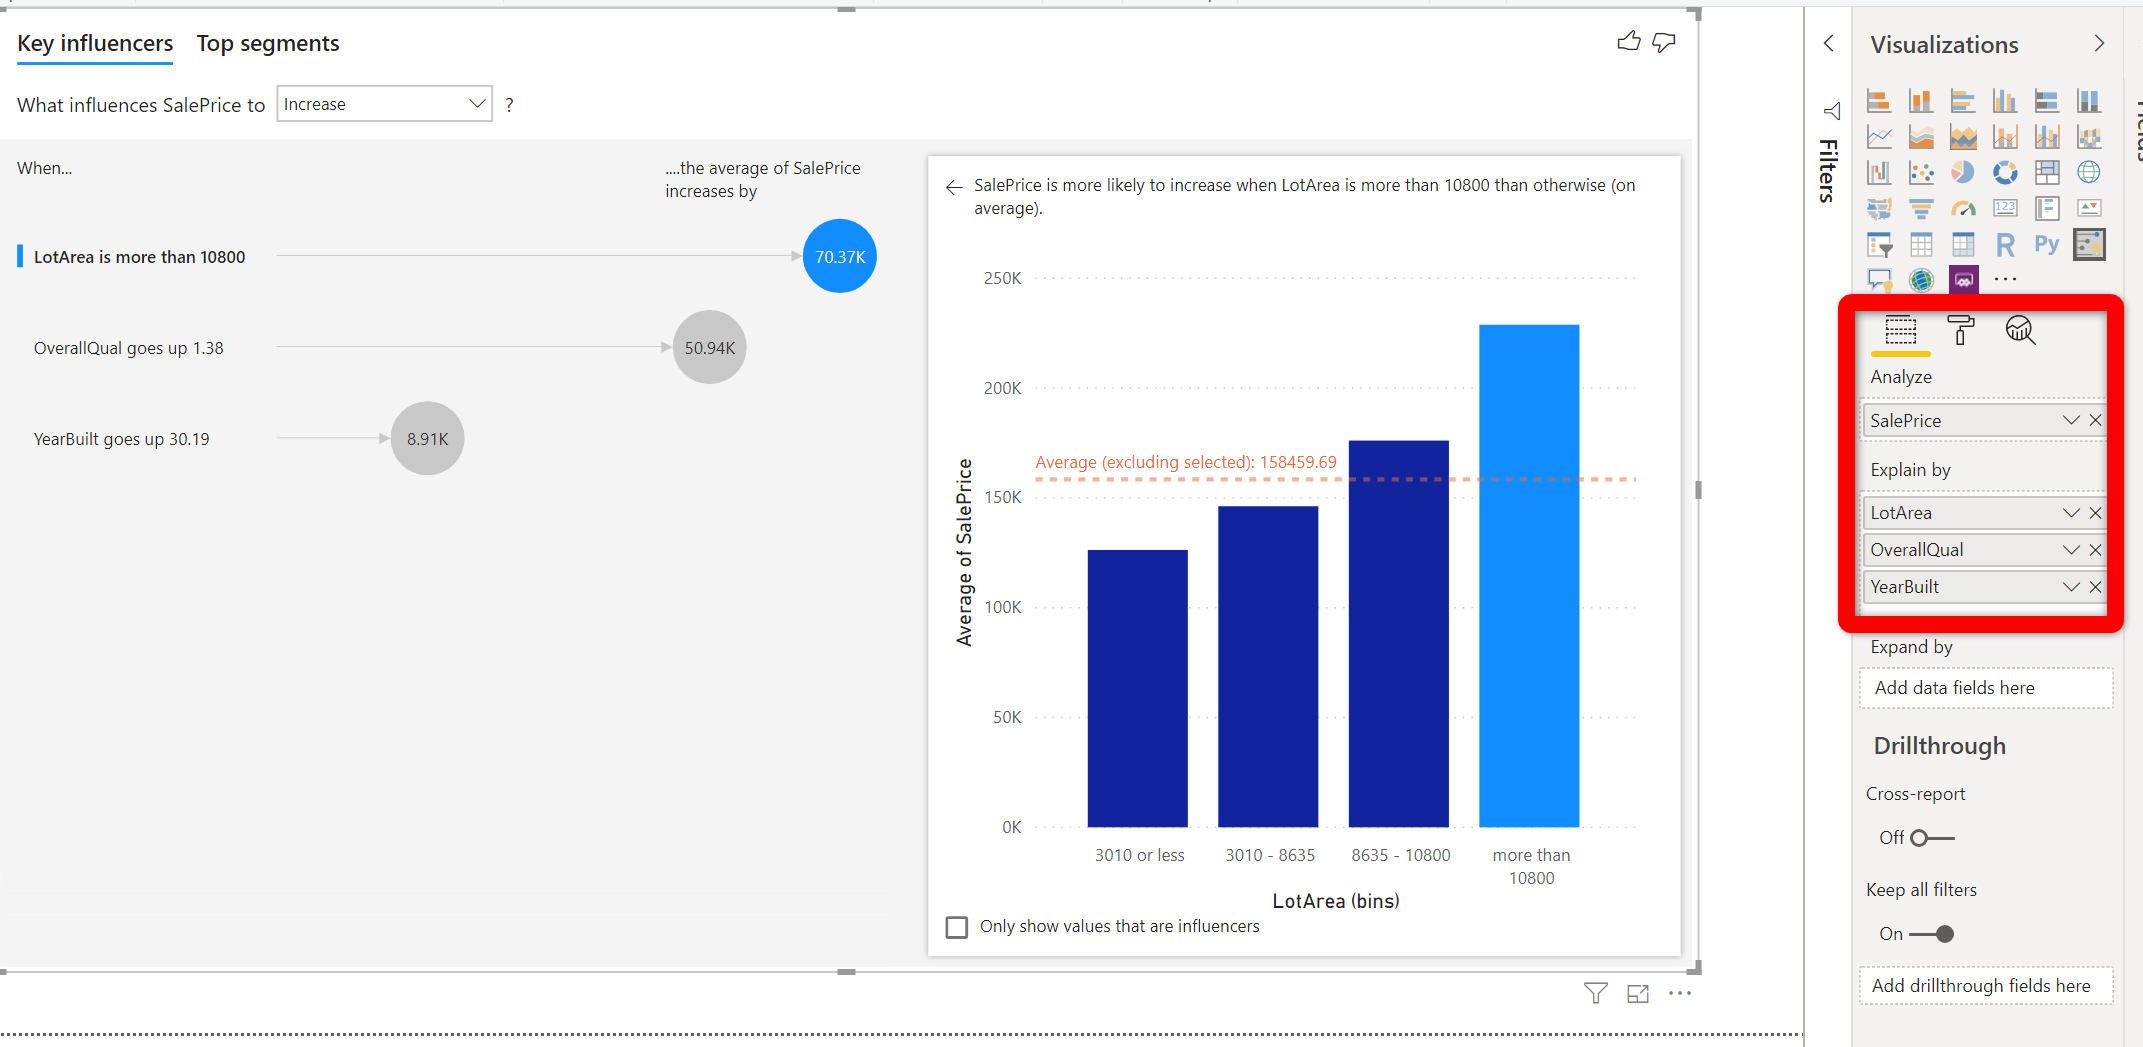
That nicely shows the LotArea has more influence, now imagine we want to ask below question:
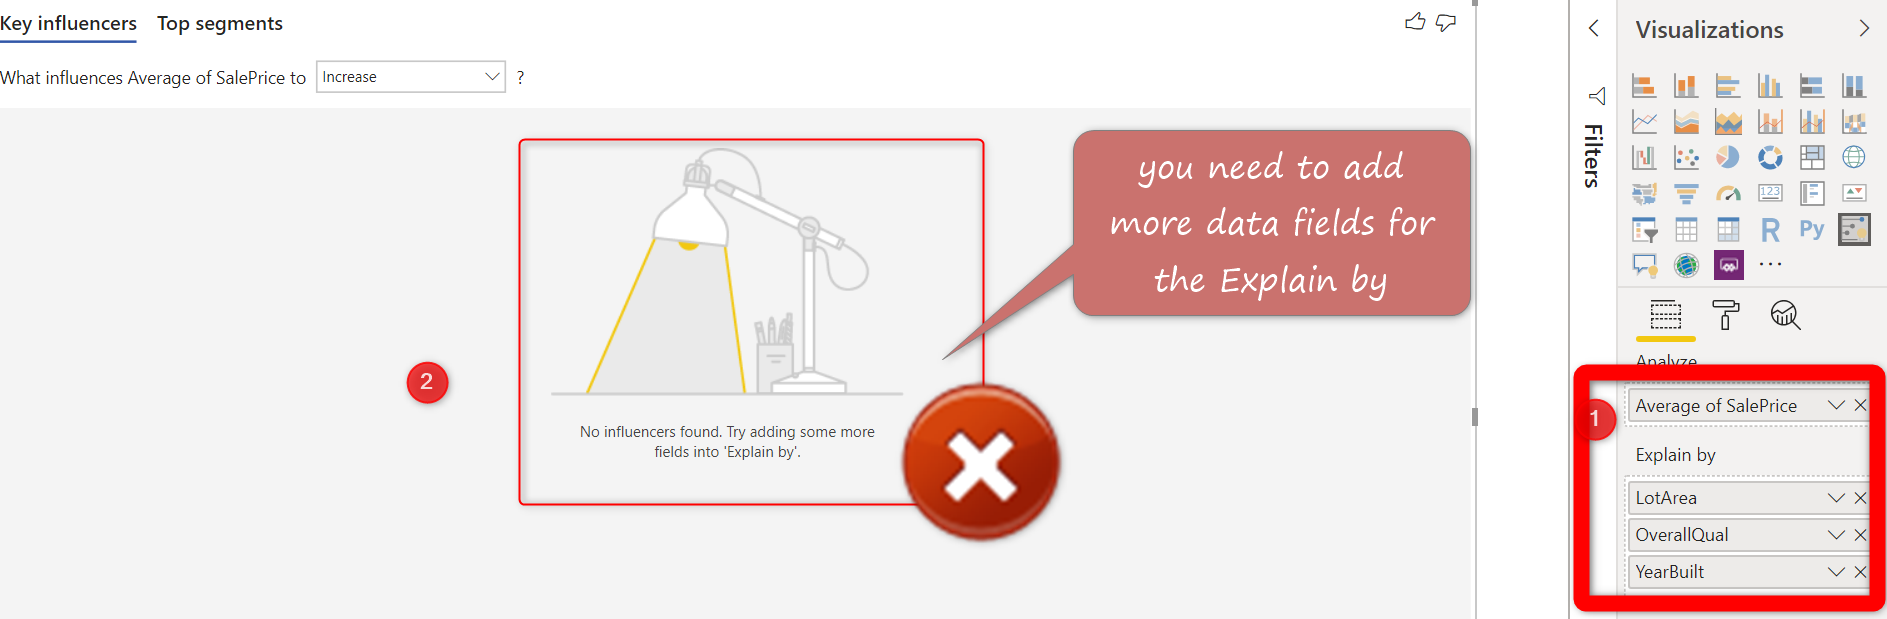
Which of these factors, LotArea, Overall Quality and Year Buil, has more influence on House Sales Price for the average sales price of House?
As you can see in the below picture, the result could not be shown up, because of below error message
” you need to have more fields for the Explain by field”
Solution
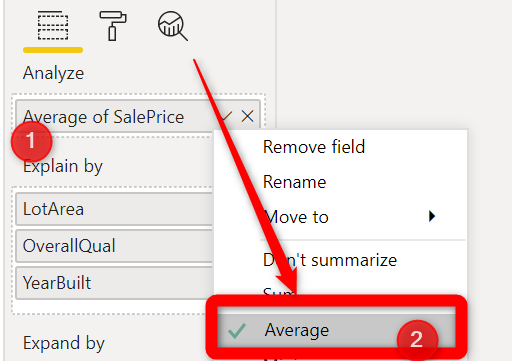
The question needs a grouping aggregation field. I change the question as below one:
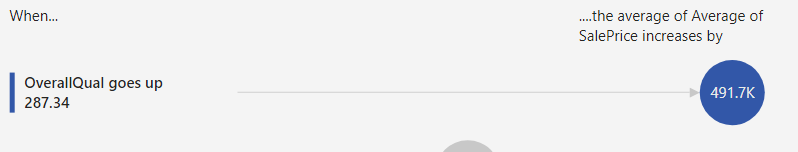
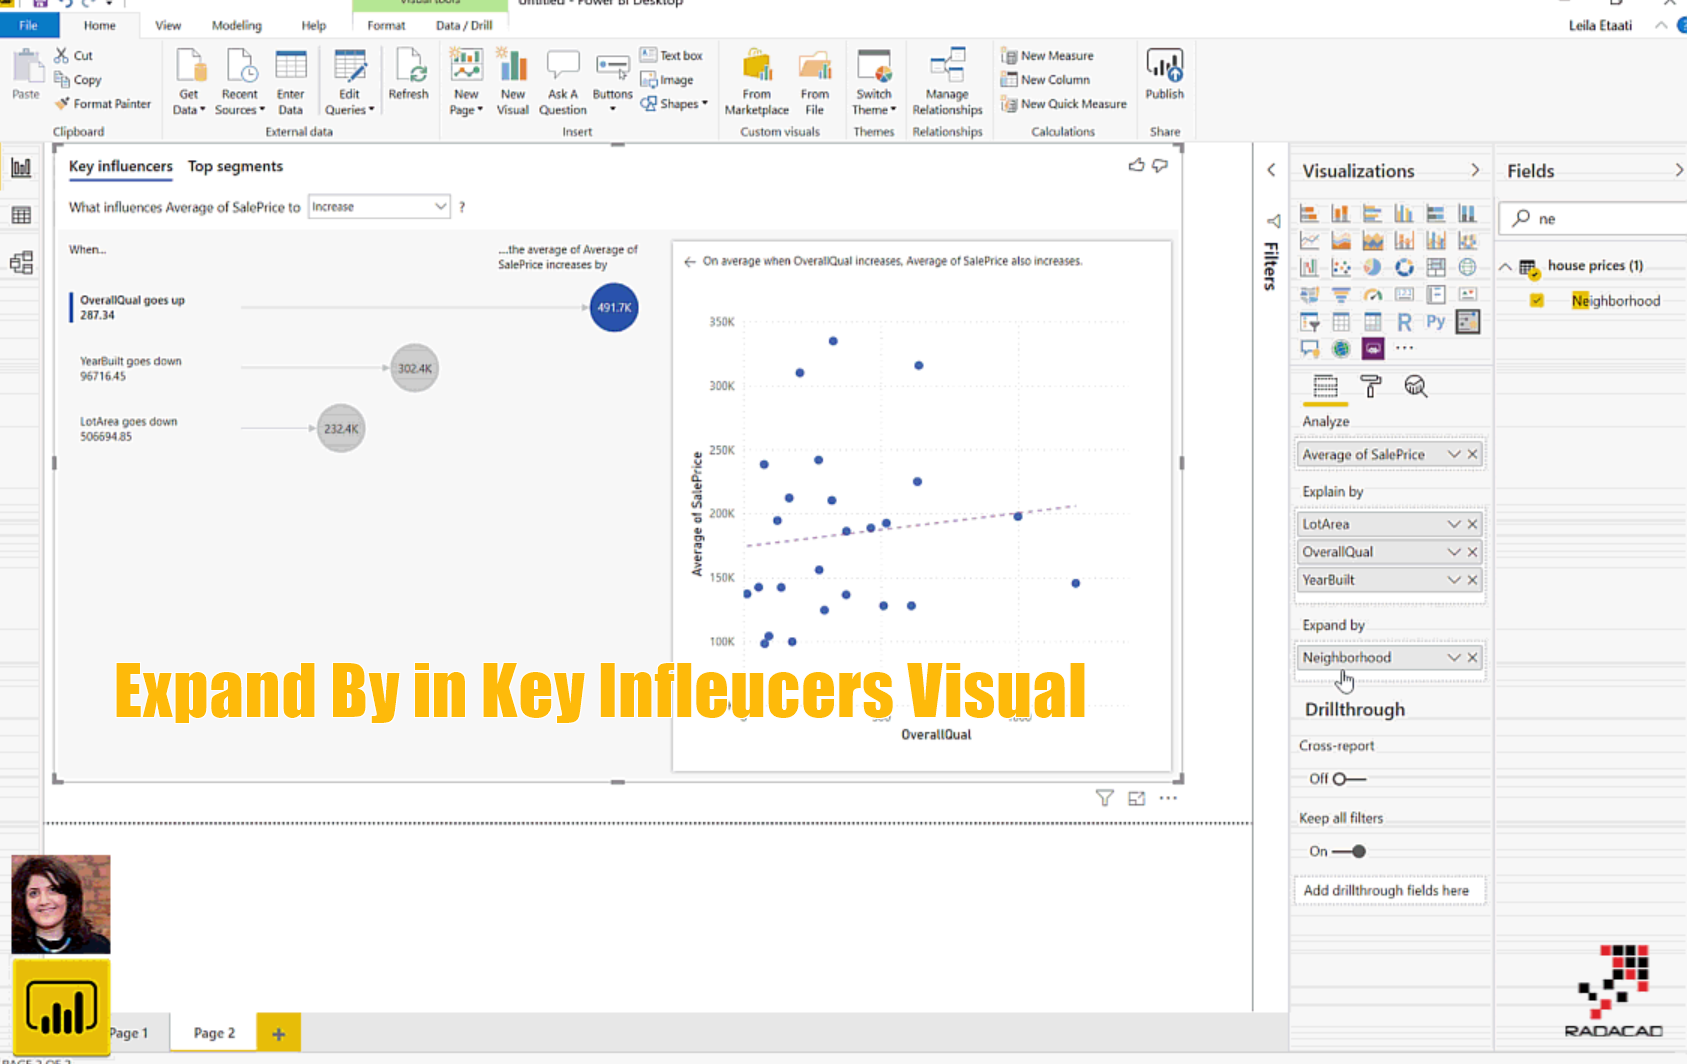
Which of LotArea, Overall Quality and Year Built which one has more influence on Average of House Sales Price for each Neighbourhood?
to solve the problem and answer the question, I need the average of sales price aggregate by other fields. Hence, I will add the neighbourhood to Expand by data field.
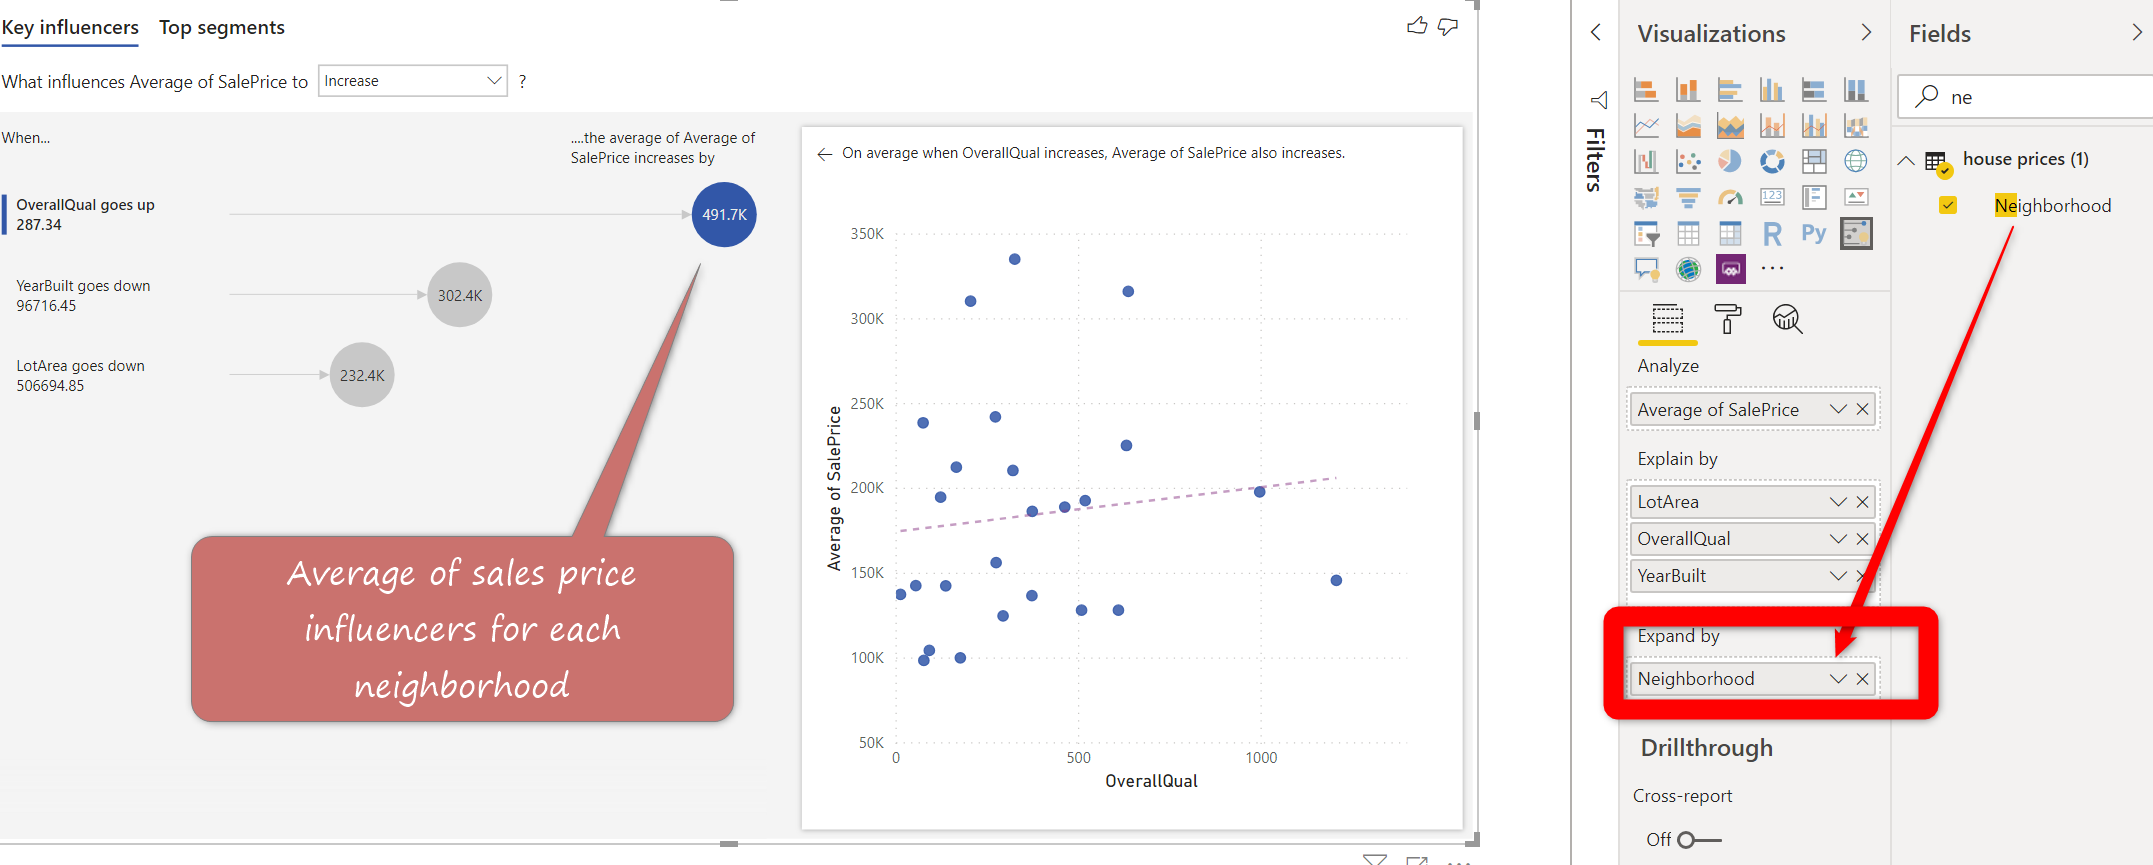
if you compare the results in first visual, we analyse the wholesales price for all type of the house ( in house level analysis) and we find that the LotArea has more impact on the sale price
however for each neighbourhood, the story was a bit different, the average house of each neighbourhood has been impacted by Overall quality more