
Key Influencers visual is now generally available ( no preview ), so having updated version of the Power BI desktop, it is no more a preview feature.
This visual is a good one for analysing the data. as I have explained in the post about it ( see here).
Now let see some other features
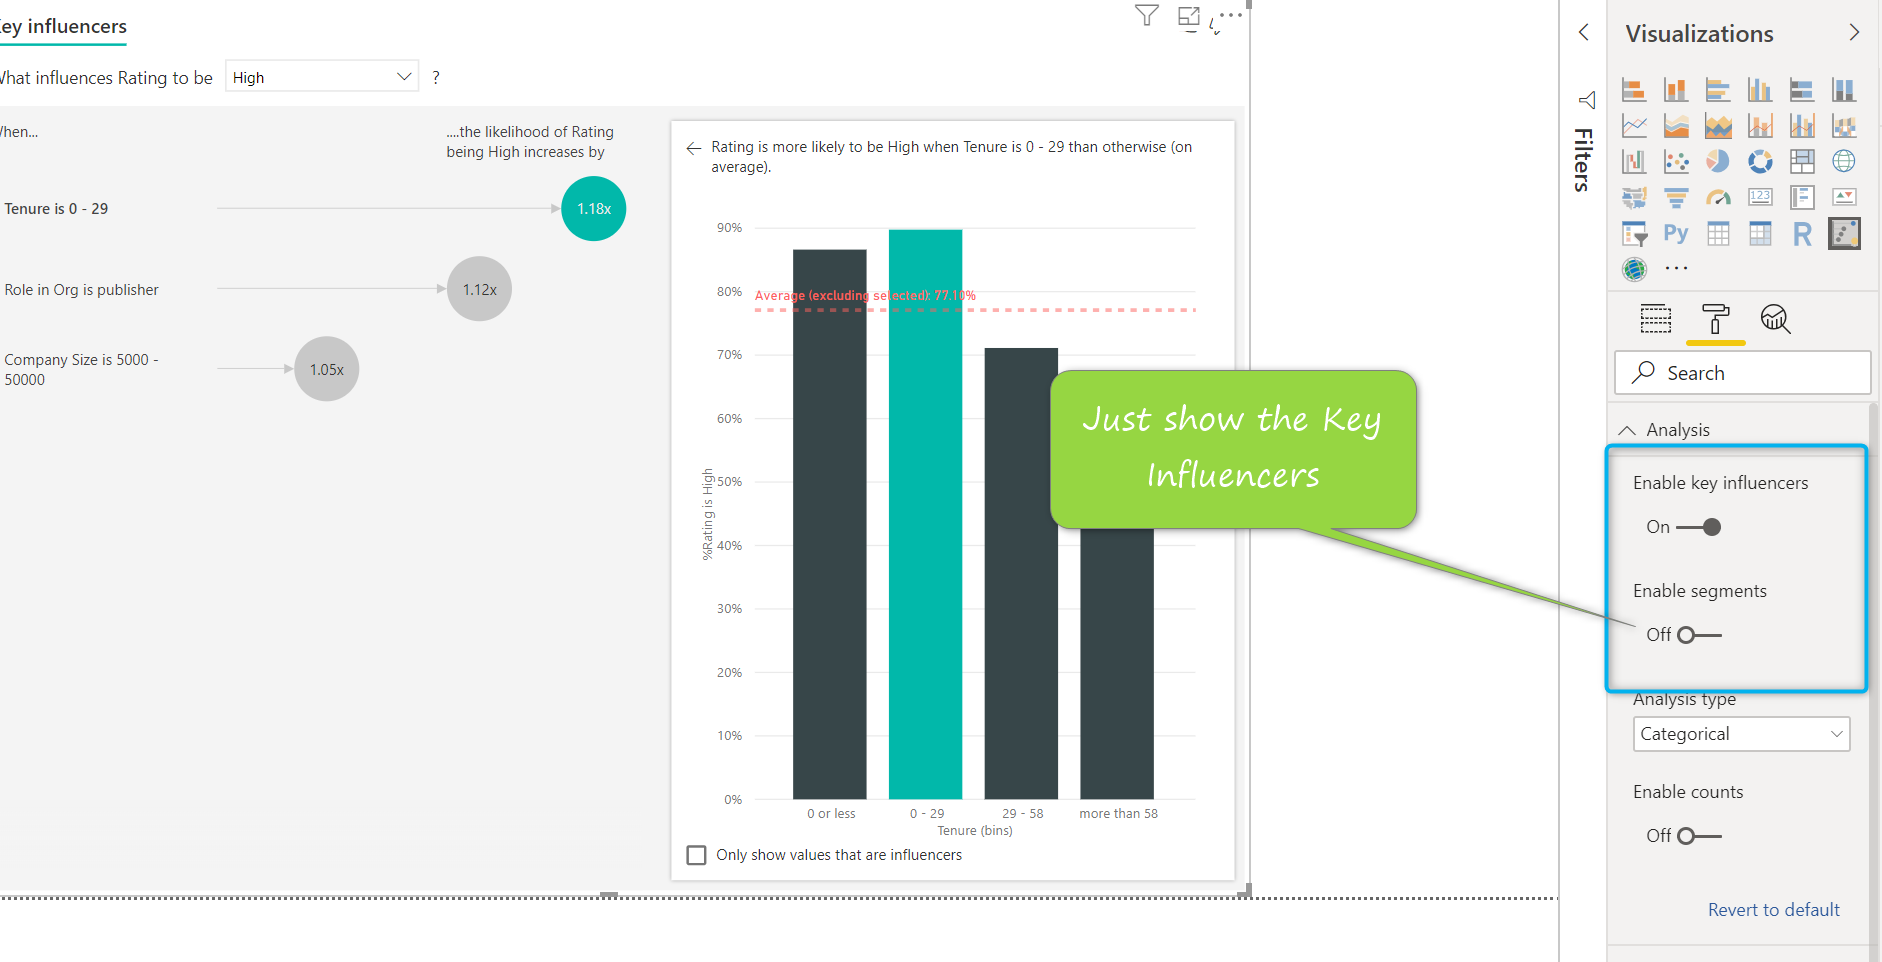
You can choose to show the Key Influencer and Segment.
For instance, for the customer feedback Scenario, we want to just show the Segment or just Key Influencers. Initially, both options are enabled, but to disable one, you can easily click on the visual, in the format option, under the Analytics, choose the Enable Key Influences off.

In the next practice you able to make the segment to be shown only to the customers
Moreover, you can see the number of scenarios and data points,
So just some clarification, in the key influencers tab, we able to see the factors that have more impact on the rating of the customer, initially it is based on the most important factors. in the above scenario are Tenure, Role in organization, and Company Size in sequence impact on how a customer rate the company.
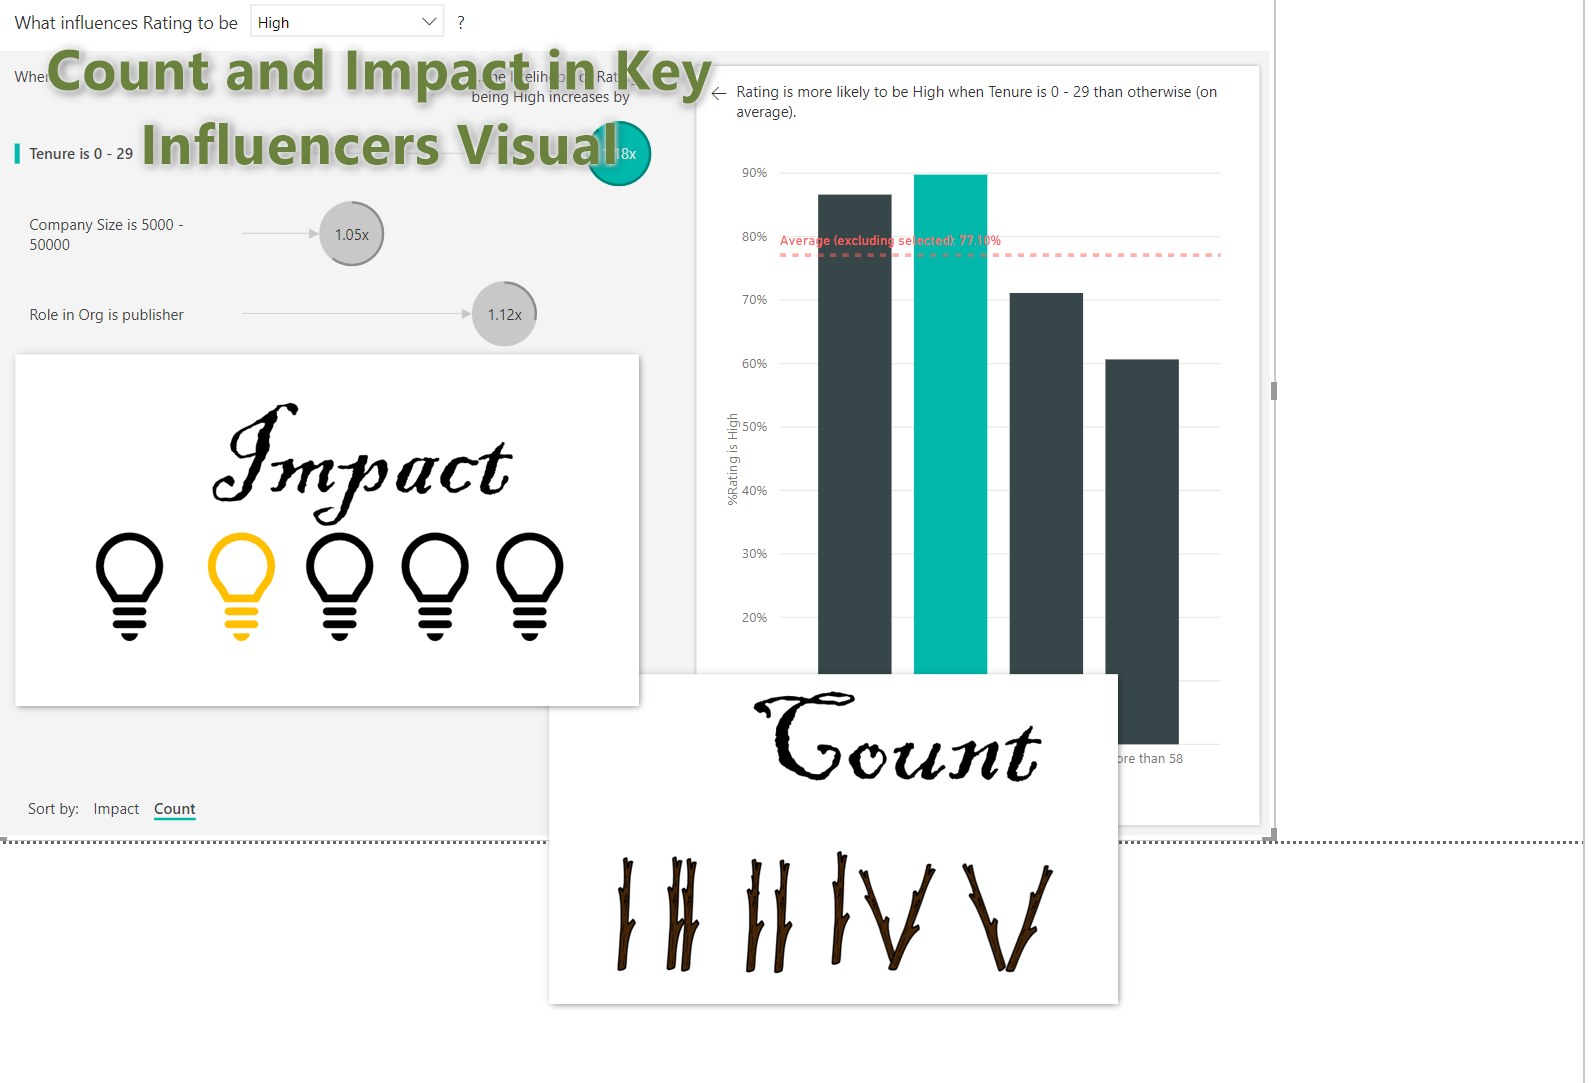
Count The Data Point
“Counts lets you get a picture of how much of your data is represented by a particular influencer, so you can focus on the influencers that impact many of your”[1]
So we have the count feature, click on the visual, then click on the format, then under the analytics, choose the Enable Count.
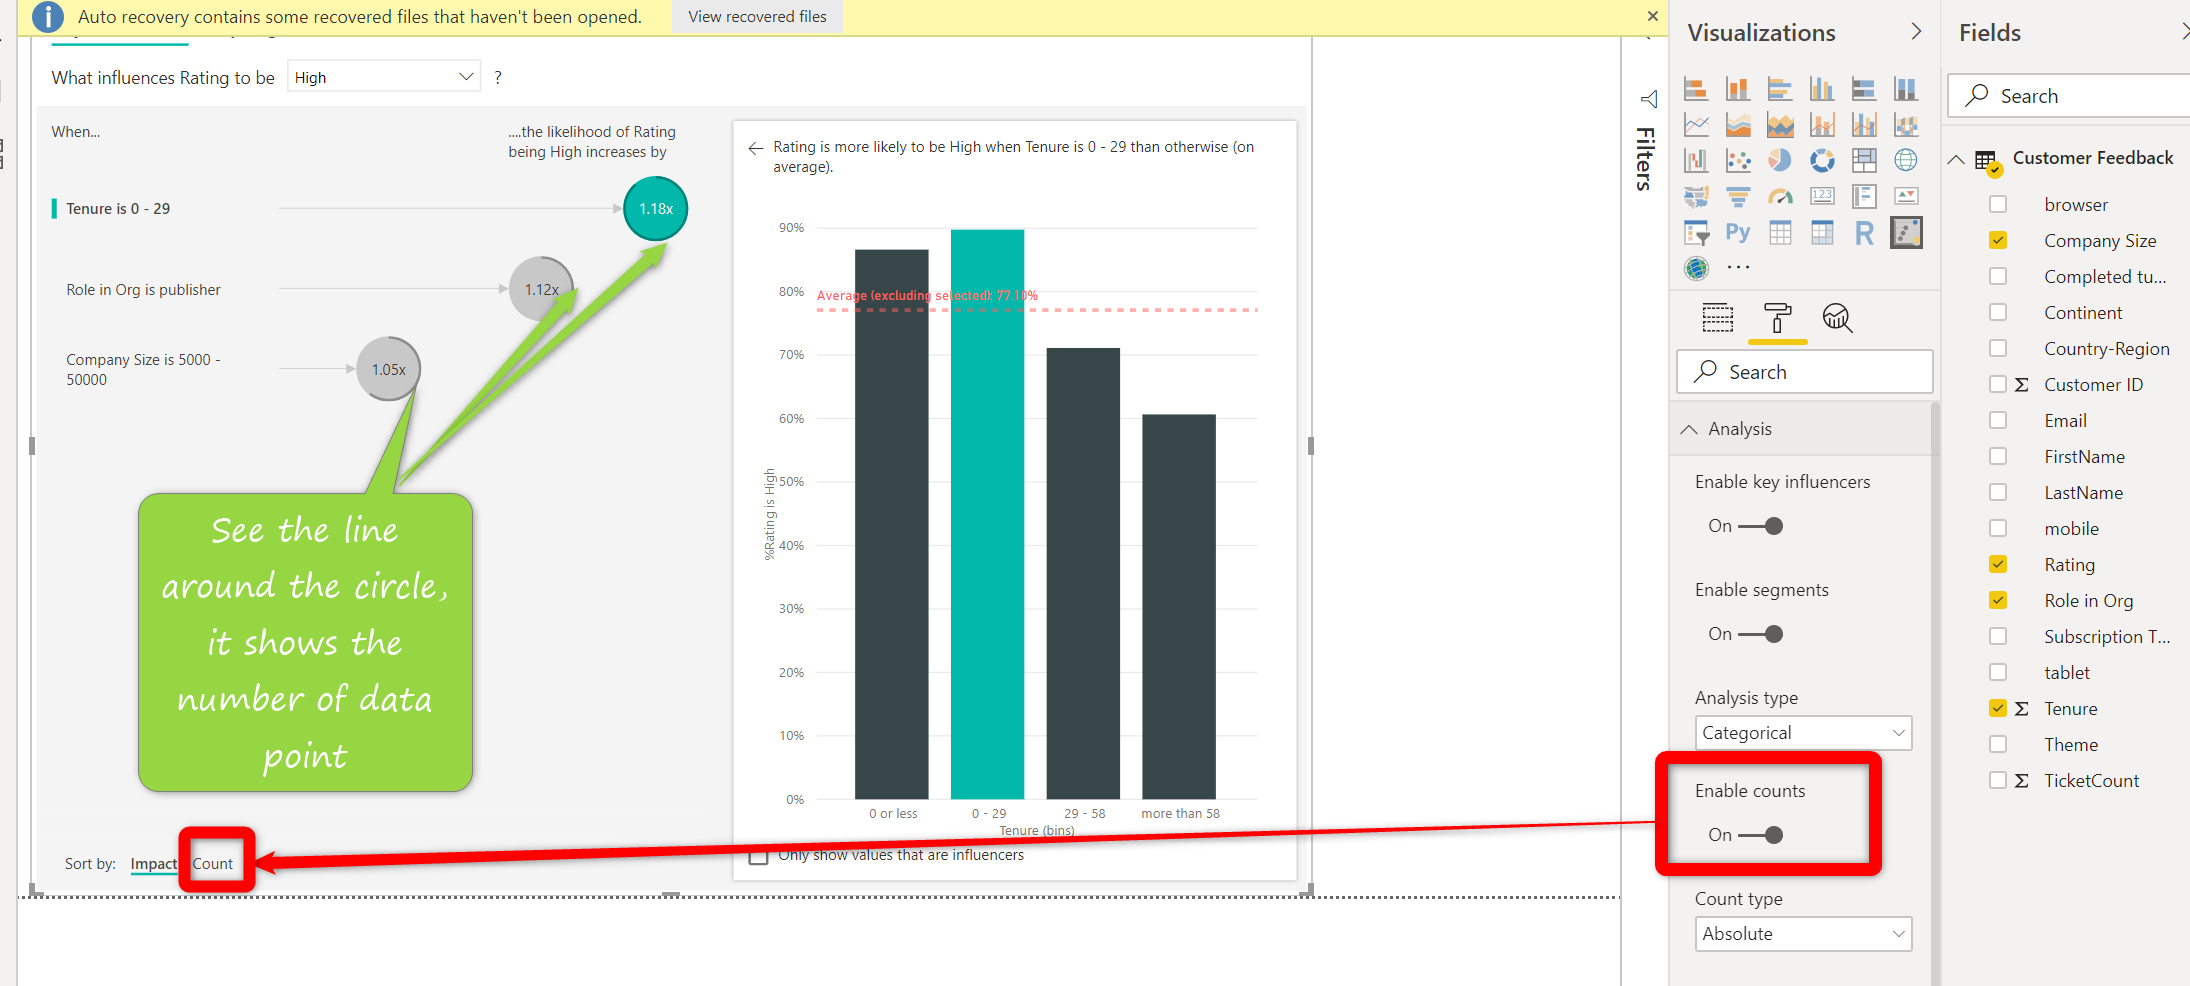
Now you can see the ring around the circle, the more of the bubble the ring circles, the more data it contains. So at the bottom of the page, you can see you able to sort based on the impact/count. The initial sorting is based on the impact, but you can now change the sorting option to Count as well. So Tenure in the below and the above picture has a high impact on customer rating and also high data pint has been impacted. But for the Company size attribute, it has a less impact on rating compare with Role in Org but has more data point with higher impacts. so you can analyse the influence of the different attributes based on their impact and count of data points.

In the next post, will share the more interesting feature of Key Influencer


