About a couple of years ago, I wrote two articles about what is association rules and how we can have them in Power BI.
In this post, I am going to put some more enhancements and show you how with data that is not cleaned how you can create Market Basket Analysis.
these enhancements are about
1- We can load any data into Powe bI and how to use Power Query for data cleaning so you can have a proper format for Market Basket Analysis.
2- how to extract the number of rules so you are able to access all rules ( not specified in previous posts).
The data is about Online retail that I download the data from Here
I load the data in Powe Query to apply Data cleaning
Transformation with Power Query
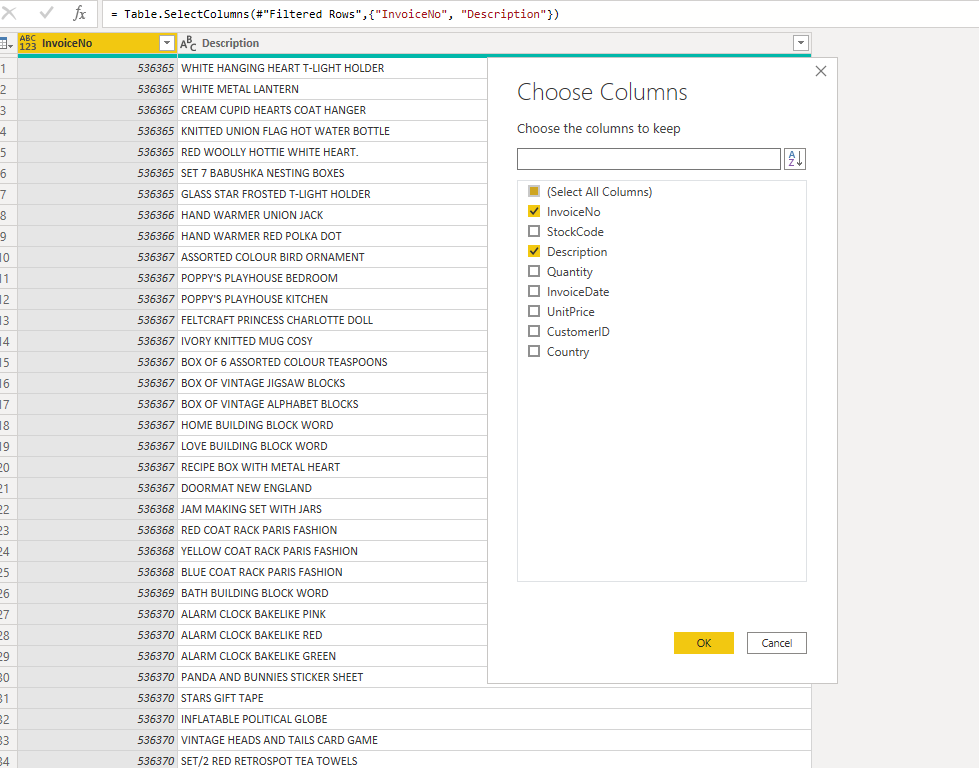
The online retail contains information about invoice numbers and descriptions of products plus some other related information. for the purpose of Market Basket analysis, I only need the description column.
As you can see in the first step, first, I remove all Null//blank values from the description.
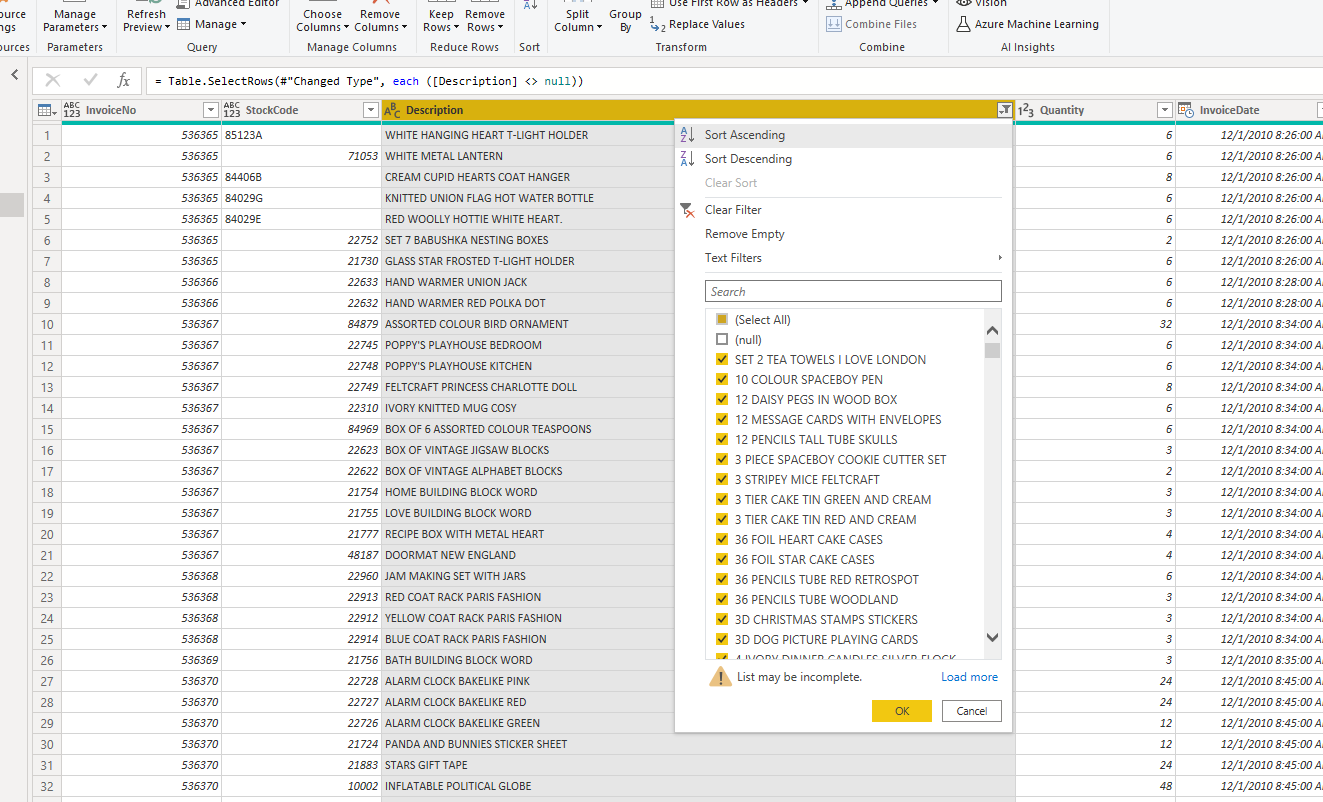
In the second step, I remove all other columns except, Invoice no, that is repeated for each item in the invoice, and the item description.
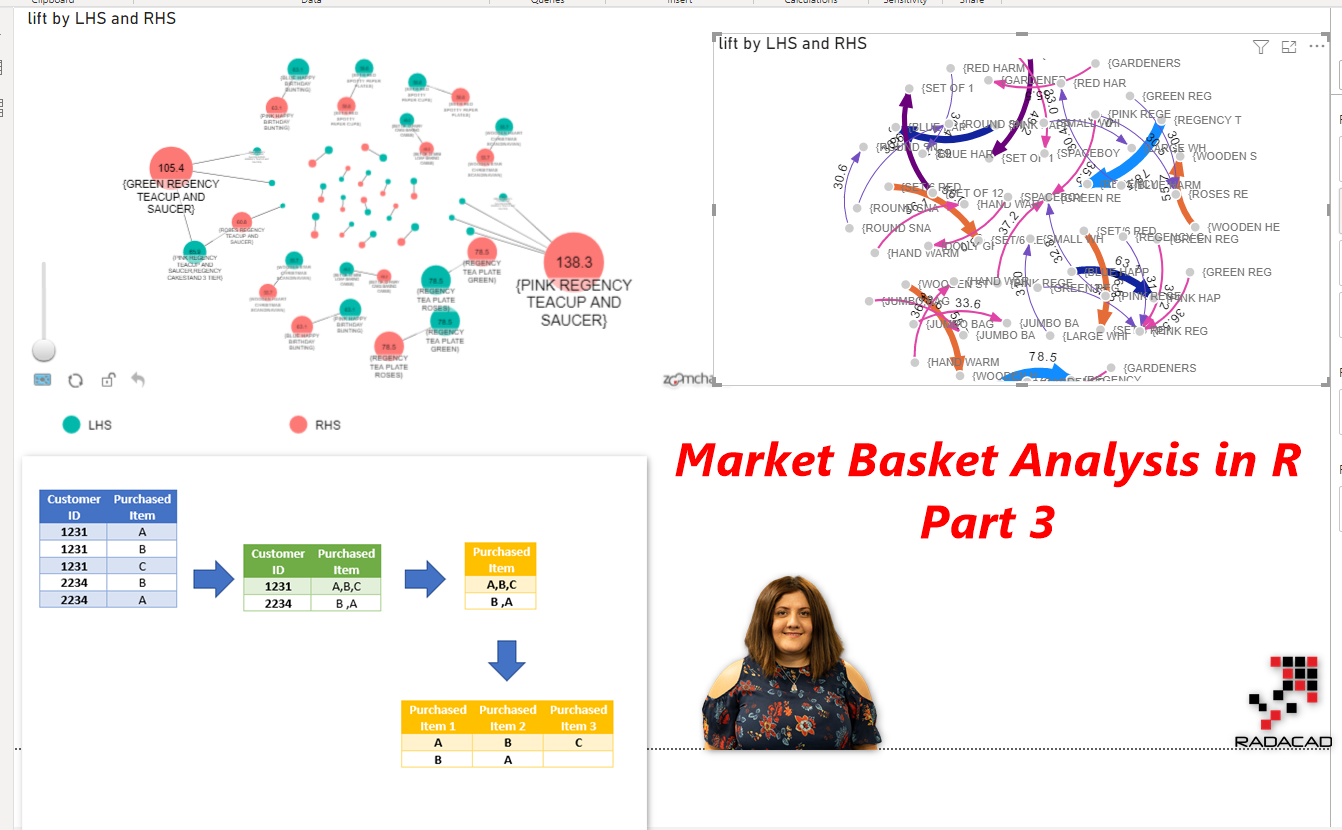
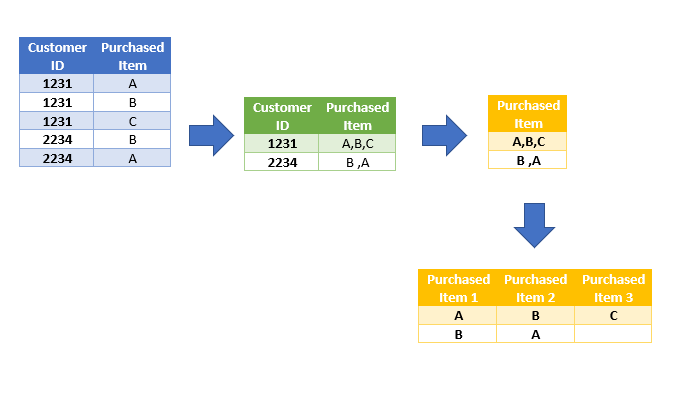
I am going to use “Apriori” algorithm in the R language for this purpose. This algorithm, need the data to be in a specific format, Transaction type, and only need data to be in the below format ( the data transformation need to be done as below)
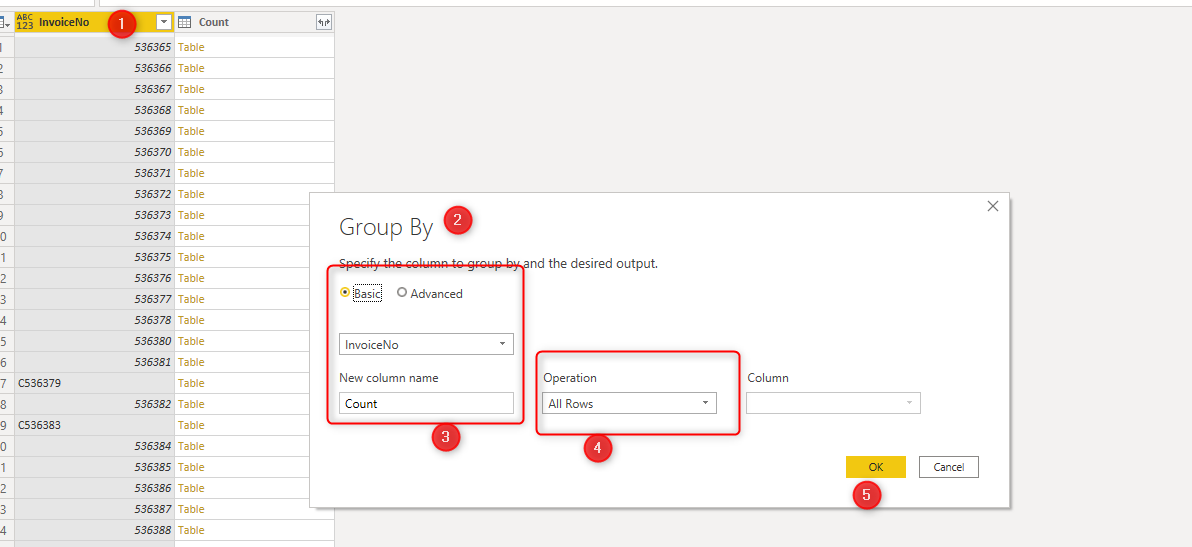
I followed the steps presented in the Reza Blog post about data transformation. first, I group by invoice number, so I can see the item description as a table for each invoice no.
Then, I need to select the description column from the recently created table ( count)
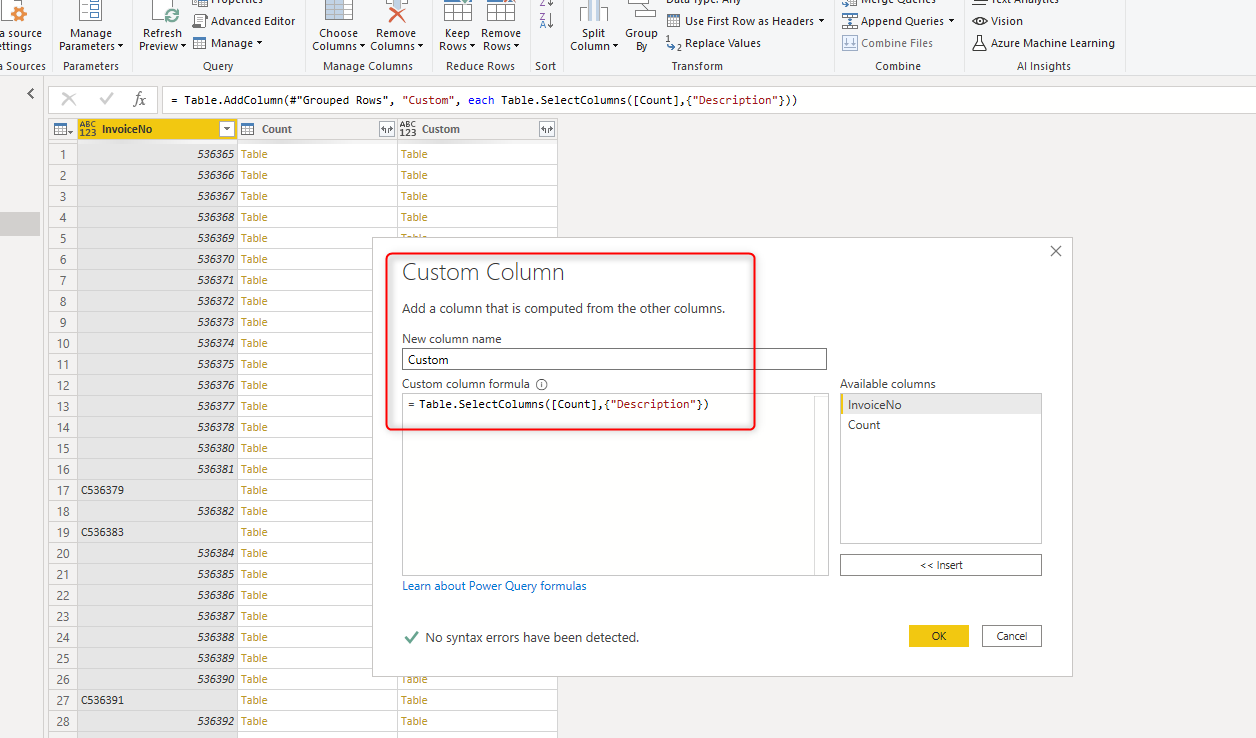
Next, I remove the count table, as I do not need I anymore. Add a custom column to convert the column to a list.
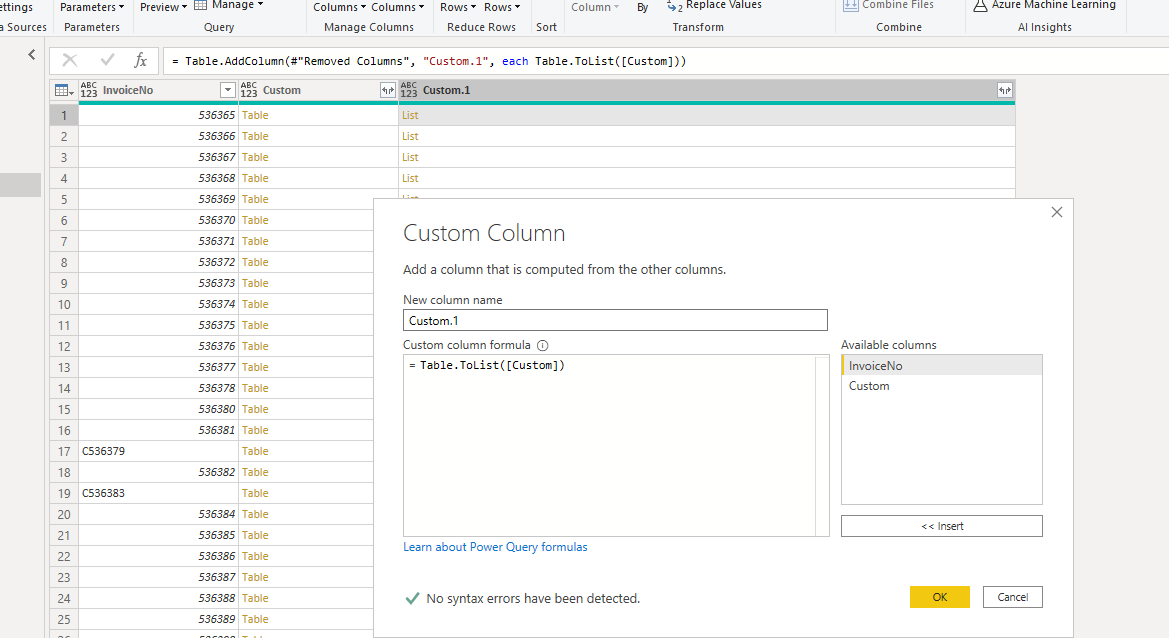
Extract the value, following all the steps in Post, and the final result was like
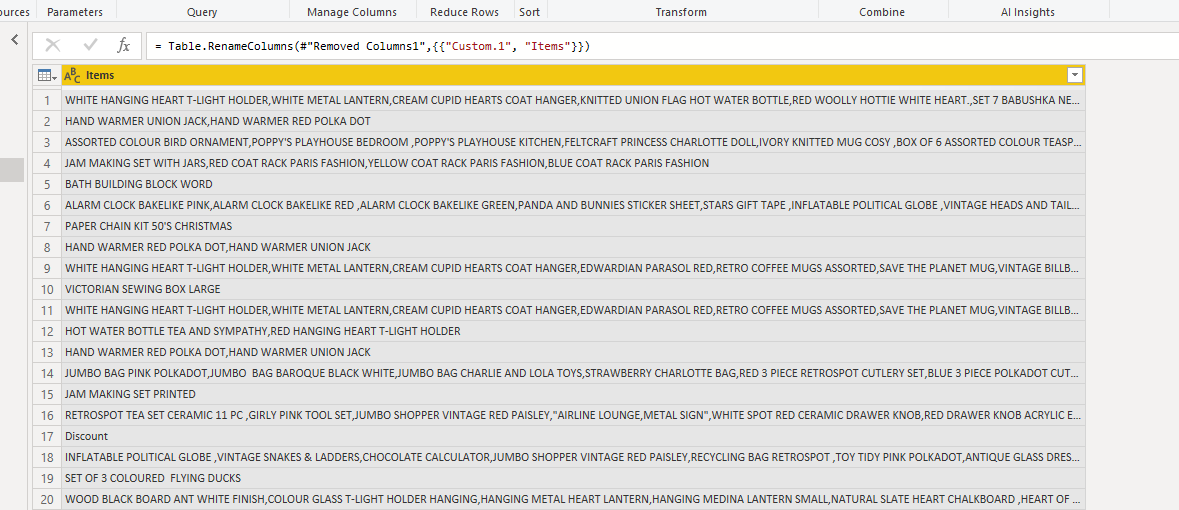
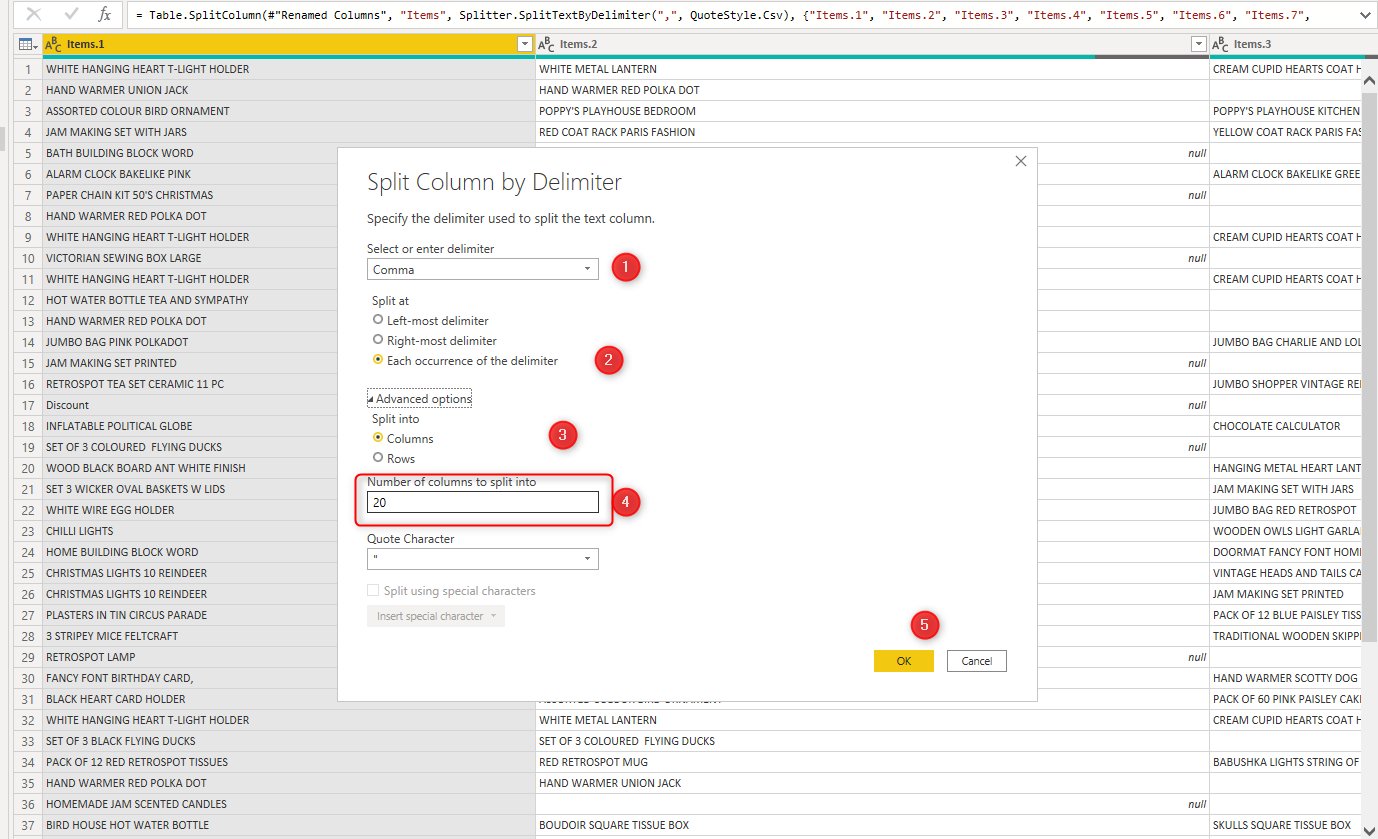
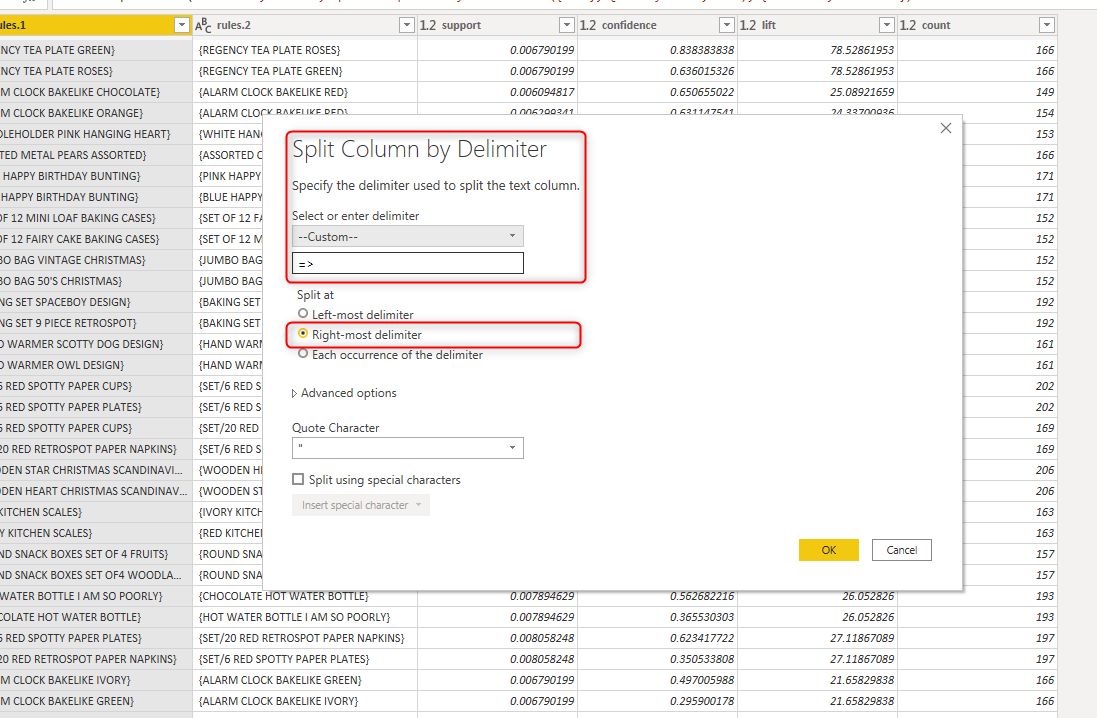
In the last step, I use the split column by comma to have each item as a separate column as below
Market Basket Analysis with R
Using R inside Power BI has been available since 2016. I am going to use the rules package ( make sure you install it in your R server)
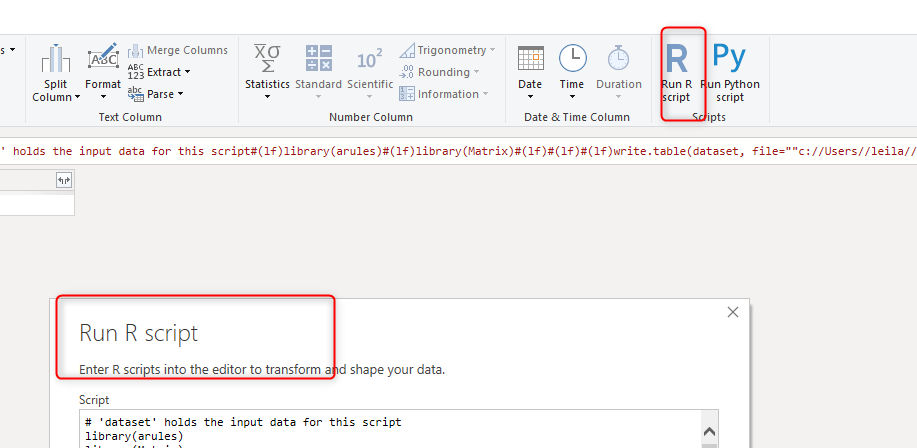
Libraries
you need these two libraries to be installed in R studio and only refer to them with the below codes
# 'dataset' holds the input data for this script
library(arules)
library(Matrix)
In the next step, I am going to write the query back into one of my folders as below, and then read it via the Transaction command. ( I still could not find a way to convert the data frame into a transaction file. will check it in future)
write.table(dataset, file="c://Users//leila//Dropbox (RADACAD)//leila speake//august2021//COurse//Market basket Analysis//Onlineretail.csv",sep=",")

groceries <- read.transactions("c://Users//leila//Dropbox (RADACAD)//leila speake//august2021//COurse//Market basket Analysis//Onlineretail.csv", sep = ",")
Next, I use the apriori function for market basket analysis in R as below
Temp<-apriori(groceries , parameter = list(support = 0.006, confidence = 0.25, minlen = 2))
Now I want to extract the number of the rules and find a way to show the final results
If you run the above codes ( except writ back into a file) in R studio you will get the below result,

The Temp variable is not a simple data frame or vector, if you select the Temp variable and run it you will see the below message
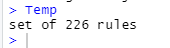
I need this number (226) to find out how many rules were generated and show the exact number in Power BI.
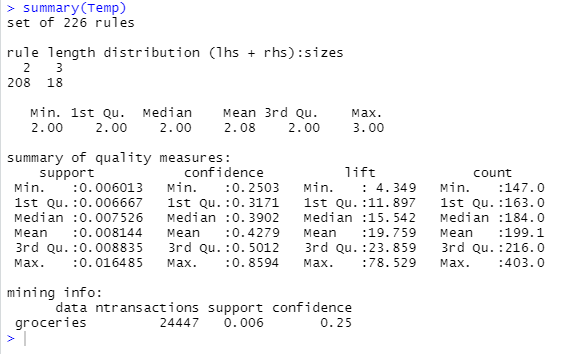
If I use the Summary() command as below, I will receive the whole result in the output. Now it is much better I can see the result in a data frame format.
summary(Temp)
In next step, I capture the output and store it back in a data frame structure to use later as below
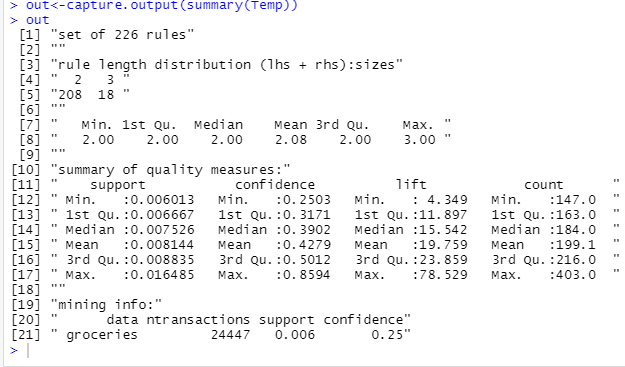
The first element in in “Out” variable is “Set of 226 rules” which I am going to use Regular expression to extract the numeric values in the variable
so the final code is as below in Power BI
# 'dataset' holds the input data for this script
library(arules)
library(Matrix)


write.table(dataset, file="c://Users//leila//Dropbox (RADACAD)//leila speake//august2021//COurse//Onlineretail.csv",sep=",")

groceries <- read.transactions("c://Users//leila//Dropbox (RADACAD)//leila speake//august2021//COurse//Market basket Analysis//Onlineretail.csv", sep = ",")


Temp<-apriori(groceries , parameter = list(support = 0.006, confidence = 0.25, minlen = 2))

out<-capture.output(summary(Temp))
rulesnumber<-out[1]

matches <- regmatches(rulesnumber, gregexpr("[[:digit:]]+", rulesnumber))

tst<-as(Temp[1:as.numeric( matches[1])],"data.frame")
This process helps me to extract the dynamic number of rules capture in the association rules function. and help me to do all data transformation in Power bI instead of R/ Python.
Finally, I split the data as below:
Show in Power BI
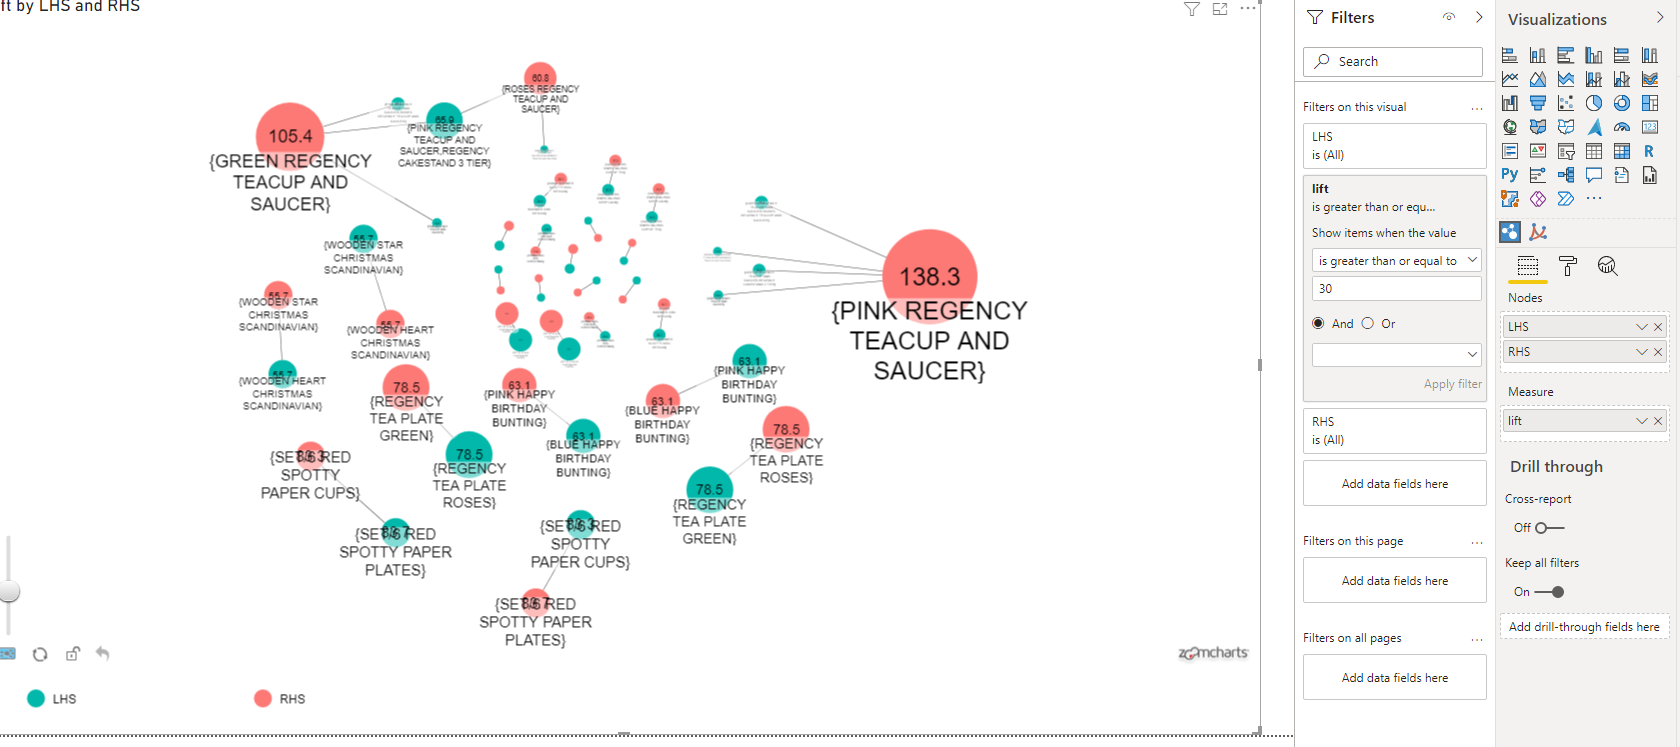
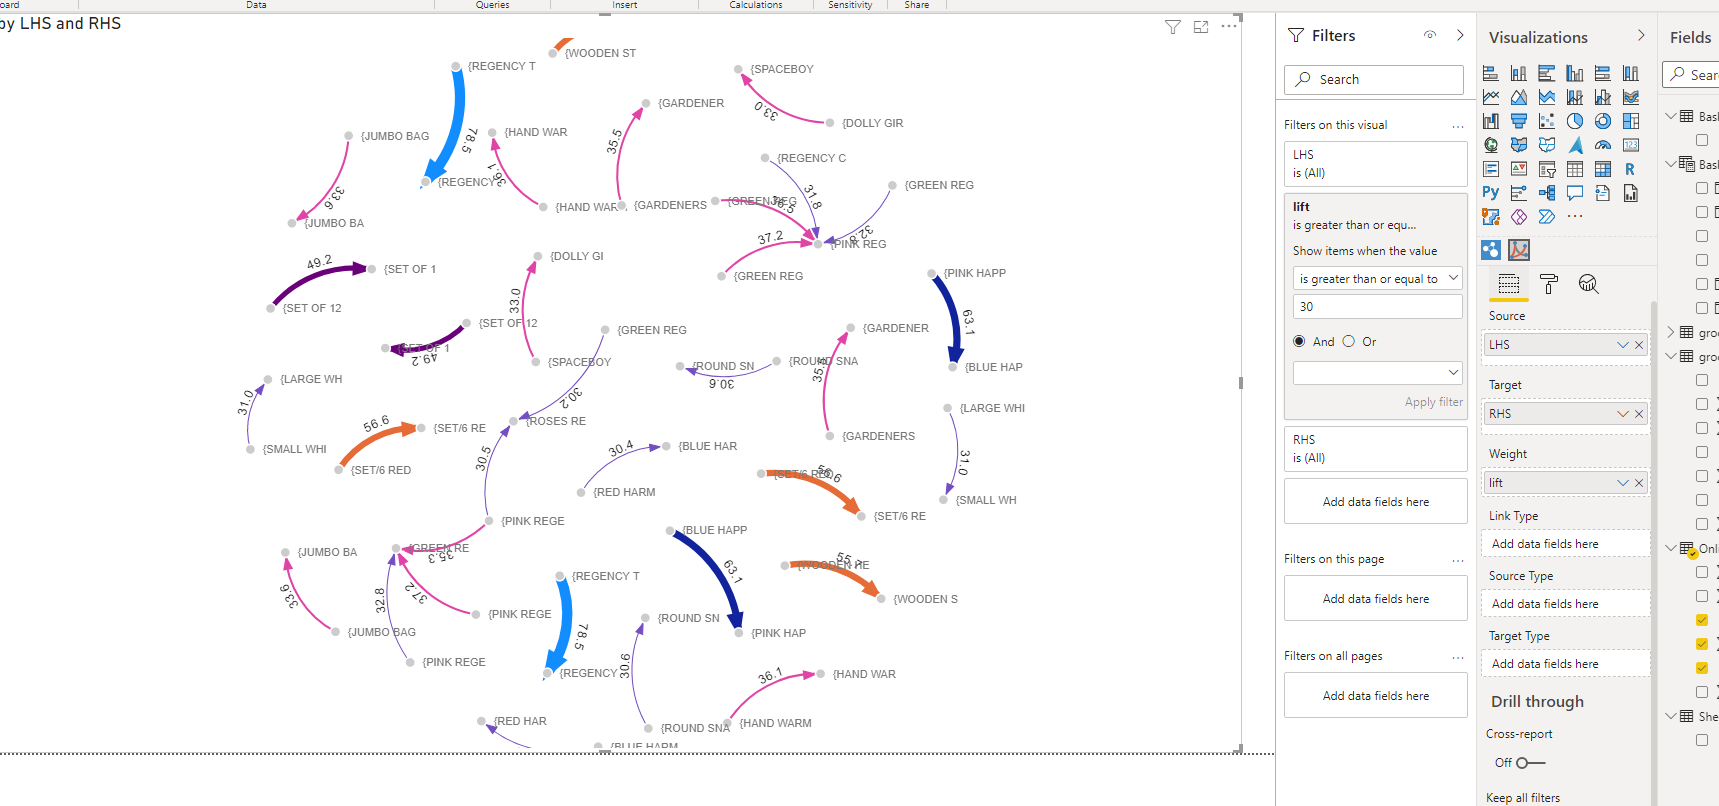
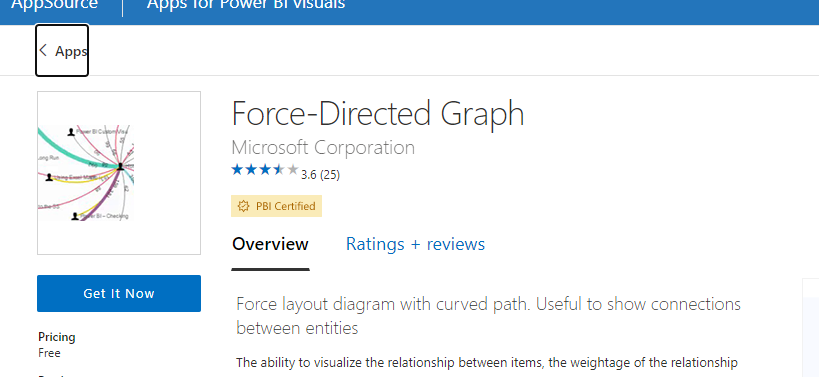
Next, you can use any network visual to show it “Advanced Network Visual” or “Force-direct Graph”
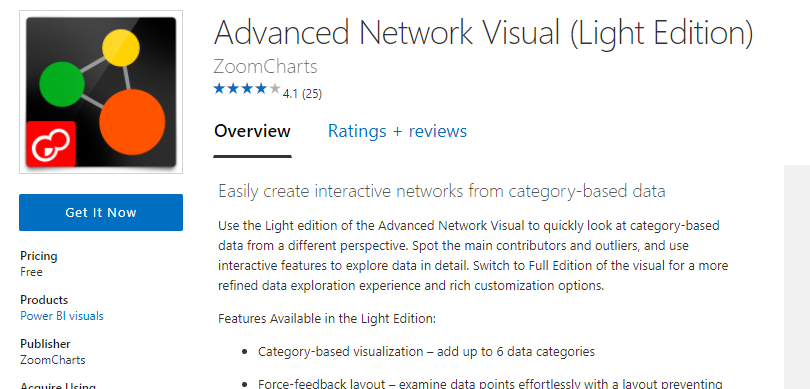
With the first one, it looks like as below, it needs the start node first (LHS) then the (RHS) rule