
Despite all articles, blog posts, and videos on the topic of DAX Measures and Calculated columns, I still hear here and there that people ask what is the difference between Measure and Calculated Column? What situation should we use each of these? and on the other hand, what is the difference of creating column here, or in Power Query? I have written previously about “M or DAX, that is the question” which explains situations that you need to use Power Query or DAX. In this post, I’m going to explain what is the difference between DAX Calculated Column and Measure. If you want to learn more about Power BI, read Power BI book from Rookie to Rock Star.
Read this If You have any of Questions Below
This blog post is written for you if you want to understand the difference between Calculated Column and Measure in DAX, and have any of below questions;
- What is Calculated Column?
- What is Measure?
- When should I write calculated column or measure?
- What is their difference in Performance?
- What are operations that I cannot do with these?
- and many other questions about the difference between these two types of calculations in DAX.
What is Calculated Column?
To understand the difference between these two types of calculation, it is necessary to understand how these are working one by one. Calculated Column is a column like any other columns, created in the table. However, the result of a calculated column is comping from calculating an expression (DAX). usually, calculated column leverages a DAX expression that applies to every row in the dataset, and the result of that will be stored in the new column.
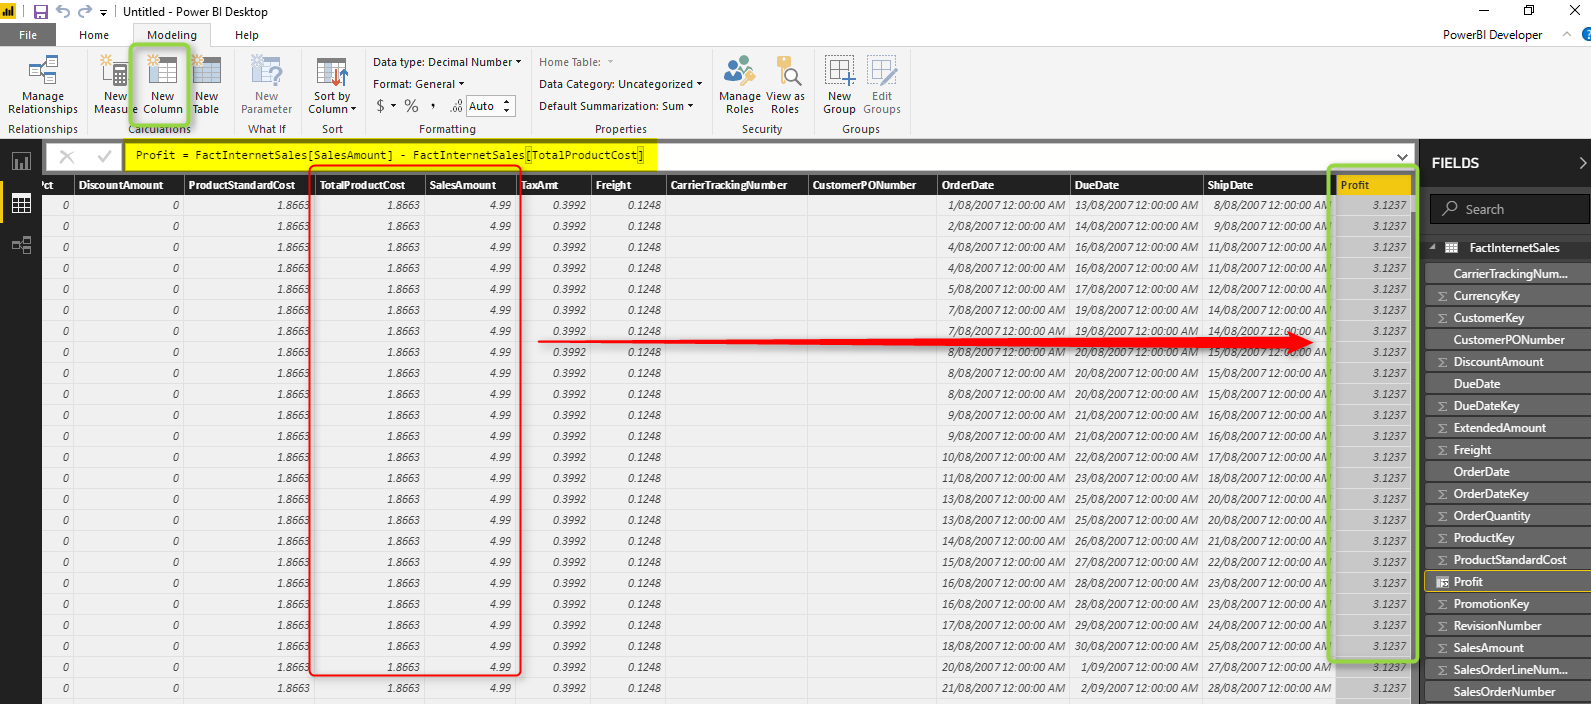
Example: Profit as a calculated column
Consider a table that we have sales and costs information in it. Calculating Profit in such table would be simply deducting costs from sales for every row. So this basically would be a calculated column.
Expression:
Profit = FactInternetSales[SalesAmount] - FactInternetSales[TotalProductCost]
Row by Row Calculation: Row Context
One of the very important concepts about the calculation that you apply in Calculated Column (In the majority of the cases, not always); is that the calculation in one row at a time, or in other words; row by row calculation. In below table; you can see the calculation result for every row stored into the new column;
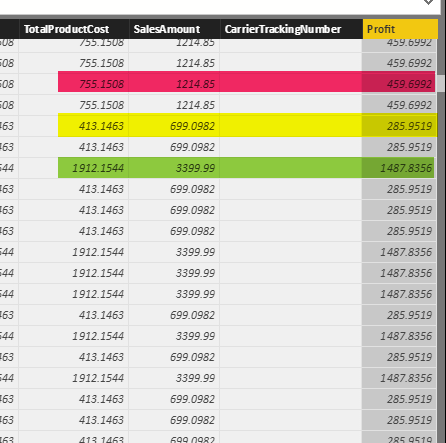
Row by row calculation called Row Context in DAX terminologies.
Stored in Memory
Calculated Column stores values in the memory, like any other columns. the calculation happens at Refresh time, and the result will be stored in the memory.
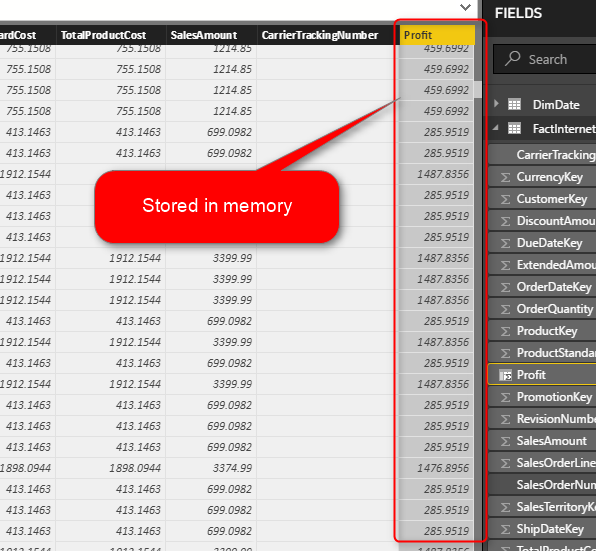
This means that more calculated memory you have, more memory consumption you will end up with, and your refresh time will be longer as well. However, many calculations are very simple, so your refresh time might not be affected too much.
Calculated Column highlights
Based on above explanations, here are highlights of a calculated column;
- Row by row calculation: Row Context (usually, not always)
- Stored in the memory (consumes RAM)
- calculated at the time of refreshing the report (either scheduled basis, or manual)
What is Measure?
A measure is usually a calculation that works on an aggregated level basis. This aggregation can be as simple as a sum of sales or can be a little bit more complex, such as calculating monthly average sales in a rolling 12 months period. Measures have dynamic nature, they affect on a subset of data from one or more table. Hence, the subset of data can be changed through the filters applied in the Power BI Report, then the calculation will have to be evaluated dynamically. So Measures are not pre-calculated, they will be calculated on the fly when adding it in the report.
Example: Sum of Sales
Measures are usually aggregations. A very simple aggregation we can use as an example is a sum of sales.
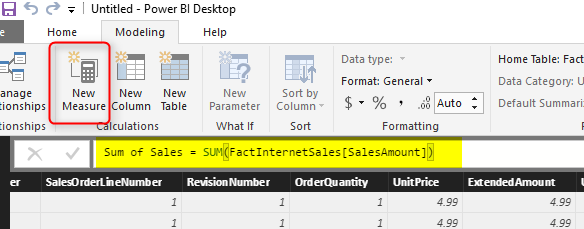
Aggregation can be done with a number of functions in DAX, such as Sum, SumX, Average, Calculate, and heaps of other aggregation functions. Now, let’s answer the most important question:
How to see the Value of the Measure?
Measures are calculated on the fly. This is, in fact, one of the most conceptual differences between a measure and calculated column. Okay, measure values are calculated on the fly, so how you can see the value?! The answer is by putting that into a report!
If I drag the measure above in a report as a card visual, then I would get a result;
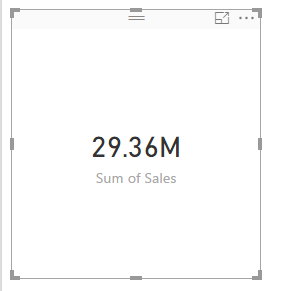
When there is no filter applied in the report, this would return the grand total of sales, $29.36M. However, if I add a slicer in the report, and select a value in it, I’ll see a different result;
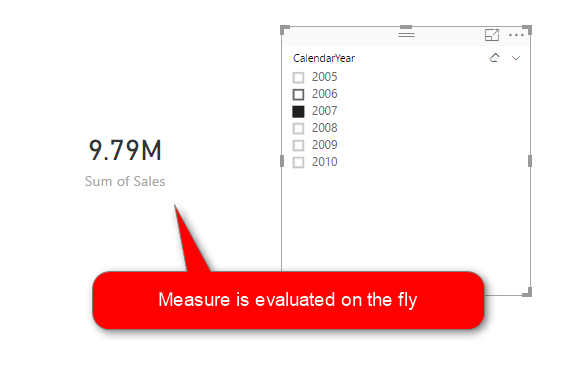
Now the measure calculation only shows me the sum of sales for the year 2007, which is $9.79M.
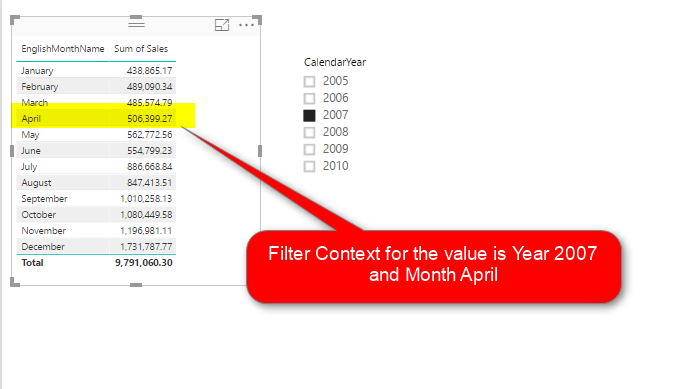
Filter Context
Measure evaluates on the fly, if there is a slicer value for 2007, then the calculation will be done on the subset of data which is for 2007. If there is a table in visualization somewhere that slice and dice data by Education category, the result of the measure will take that into account as well. We can then say this;
Measure evaluates the value based on the subset of data selected by filters, slicers, or slicing and dicing components of visuals in the report. This filtered dataset, called Filter Context.
Filter Context basically is a combination of all filters that effect on the calculation of measure. There are much more to talk about when we say filter context. However, this should be enough for understanding rest of this article.
Measures do not consume RAM, they consume CPU
based on what you’ve learned above; measure calculation is done on the fly. This means to measure value is not stored in the memory. The measure will not consume Memory or RAM at all. On the other hand, Measures consume CPU, because their calculation should be done right at the time of visualizing it. If you change a filter or slicer, the calculation should be done again. Because the response time should be fast, then this calculation happens by CPU.
What is the side effect?
If you have many measures in your report, and their calculation is also complex calculation, then with changing every filter or slicer, you end up with a lot of rounding circles which shows CPU is desperately working hard to calculate all values.
Measures highlights
Based on above explanations, here are highlights of a Measure;
- Calculated based on all filters: Filter Context (usually, not always)
- Is not Stored and is not pre-calculated
- Calculated on the Fly when you put it on a report page when you change a slicer, filter, or click on a column chart or any other visual to highlight and it affect this measure’s value.
- Consumes CPU for calculation.
When to use Measure, and when to use Calculated Column
Now that you know about these two types of calculation, we come to the critical question: When to use which? Do you need a Measure for your calculation or Calculated Column? The answer to this question is depends on what you want to calculate? This is an important question that you should be asking yourself when you want to create a new calculation:
Is the calculation row by row? or it is an aggregation? Is it going to be affected by filter criteria in the report?
If the calculation is row by row (example: Profit = Sales – Cost, or Full name = First Name & ” ” & Last Name), then Calculated Column is what you need.
If the calculation is an aggregation or it is going to be affected by filter criteria in the report (example: Sum of Sales = Sum(Sales), or Sales Year to Date = TotalYTD(….)), then Measure is your friend.
Let’s go through some examples;
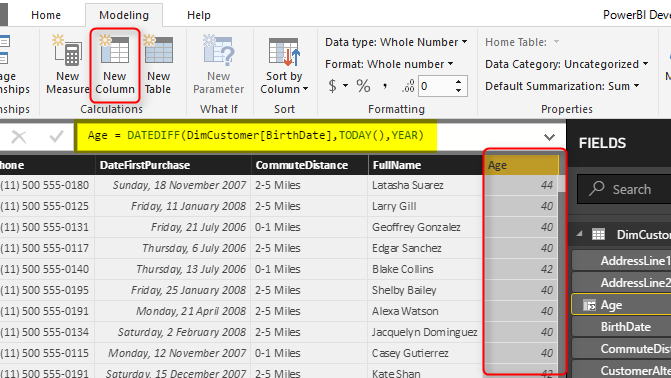
Example 1: Calculating the age of customers
Age of customers does not change based on filters! It is only dependent on one thing; birthdate of the customer. and in the customer table, usually, you have the birthdate as a field. So this calculation can be simply a calculated column, which evaluates row by row for every customer.
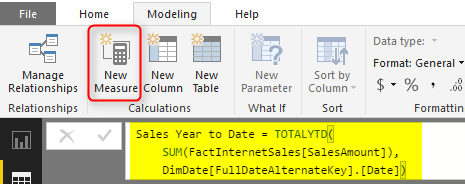
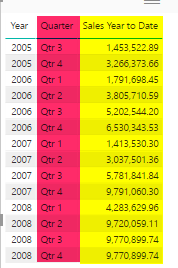
Example 2: Calculating Sales Year to Date
Year to date calculation depends on the filter criteria in the report, and also it is an aggregation. It becomes very complicated to calculation year to date for all variations of fields (per day, per month, per customer, per product, and etc). So this needs to be a Measure.
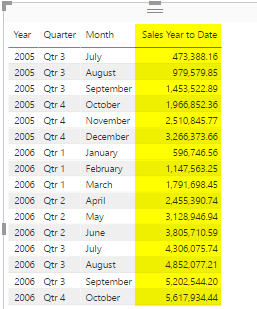
every time you put this measure into a report it calculates based on the filter criteria of the report;
Calculated Column or Power Query?
When it comes to calculating row by row, then Power Query is a better option in the majority of the cases. I have explained before what is M or DAX, and what are scenarios that you need to use each. Calculated Columns (in the majority of the cases, not always), can be implemented by Power Query. Read my other post about M or DAX; That is the question to learn more about this.
Measure: The Hidden Gem of DAX
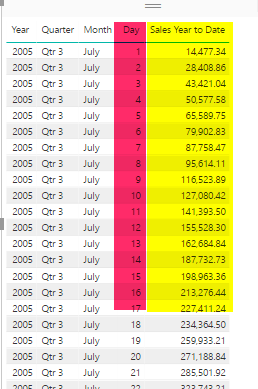
You can do a Calculated column in the majority of the cases in Power Query as well, and in fact, it is much better to do that in Power Query in those cases. This means the hidden gem of DAX is Measure. Measure calculation is dynamic, on the fly, and based on filters applied in the report. The dynamic nature of measure calculation, make it the invincible feature of DAX or Power BI. You have seen in above calculation that Year to Date value is showed by month. If you simply bring Day value in the table, then this calculation will evaluate on a daily basis and works still perfectly fine;
If you do it on a quarter level, the year to date calculation evaluates on the quarter level;
This Dynamic nature of Measure calculation in DAX is something that you cannot find in many tools. That is why Measures are so commonly used in DAX. In fact 70% of your time when you write DAX is used for writing measures, if not more!
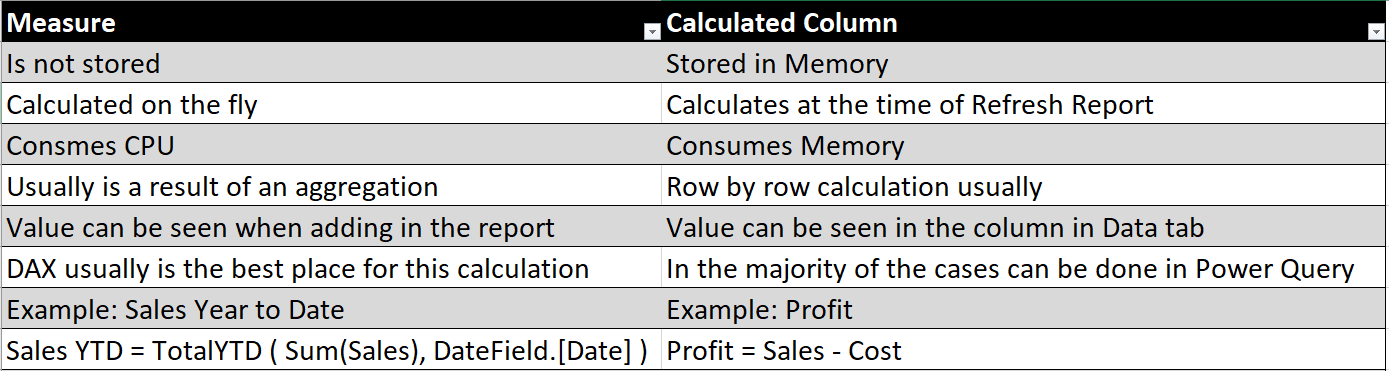
Summary: Calculated Column vs Measure in nutshell
Let’s wrap up it all and go through comparison of these two types of calculations in DAX;
Hopefully, this post, helped you to understand the difference between these two types of calculation. If you have any questions, please don’t hesitate to post your questions below.
Video


Reza is author of more than 14 books on Microsoft Business Intelligence, most of these books are published under Power BI category. Among these are books such as Power BI DAX Simplified, Pro Power BI Architecture, Power BI from Rookie to Rock Star, Power Query books series, Row-Level Security in Power BI and etc.
He is an International Speaker in Microsoft Ignite, Microsoft Business Applications Summit, Data Insight Summit, PASS Summit, SQL Saturday and SQL user groups. And He is a Microsoft Certified Trainer.
Reza’s passion is to help you find the best data solution, he is Data enthusiast.
His articles on different aspects of technologies, especially on MS BI, can be found on his blog: https://radacad.com/blog.
Great post, thanks.
I think that the last 2 lines in the summary table was switched,
Profit should be as calculated column abd sale ytd should be as a measure.
Thanks Nir for letting me know. Fixed now 🙂
Hi Reza,
are you sure measures don’t use RAM? They don’t of course when no query is running, but I’ve seen queries with complex measures (lots of FILTER statements) where memory usage was going through the roof because of all the in-memory tables (result tables of FILTER) where DAX was iterating over.
Hi Koen.
Measures depends on the DAX expression and functions used, use RAM. However, they usually release it after the calculation. Expressions that leverage iterator functions such as SUMX, AverageX and things like that, iterate through rows, apply expression, save the result in RAM, and then finally apply aggregation on the whole result set, and release RAM. so memory usage at the time of calculation goes high at some stage, but then will be released. The part that I said they don’t use RAM; actually meant that RAM will not be consumed as (not released).
Cheers
Reza
Hi Reza,
Thanks for the ‘Ahhh, of course!’ moment.
In my model I have defined a measure using a SWITCH() function to select one of 30 or more other measures to calculate based on user selection. In this instance, are the measures ALL calculated or just the first one matching the criteria? I am curious as to the load impact of this technique.
Thanks again!
Hi John,
Just the one that is in the flow of execution. For example, you said; switch (criteria, measure1, m2, …) only flow of execution goes through one of these.
Cheers
Reza
You chewed this topic, we just had to swallow it. 🙂 Thank you so much ! I often read your articles and I am very thankful for your useful work.
Hi Reza,
What if I need to calculate row by row and Is it going to be affected by filter criteria in the report?
Tks
Hi Diego.
please tell me an example of this requirement?
if you want the calculation to be done row by row by a measure, you can still bring the measure and visualize it in a table, which then bring the row context into the filter context
Cheers
Reza
Great post! Thanks!!
One question, is it possible to change measures on the fly without having to update the Tabular Project on Visual Studio?
Suppose I have
Measure1 := Sum(ColumnA) / Sum(ColumnB)
Now business wants to change this calculation to
Measure1 := Sum(ColumnA) / Sum(ColumnC)
Am I able to change this formula without having to go to the project? Maybe via a xmla?
Hi Henrique
you cannot create measures on the fly. HOWEVER, you can change the calculation of the measure by the selection of an item in the slicer. that uses a pattern called parameter table. I explained how it works here as an example
Cheers
Reza
Hi Reza
Thanks for this valuable information it is very useful for me to clear few doubts regarding this concepts.
I’m glad it is helpful Ehtesham!