
In this post, I am going to show how we can do time series inside Power BI using custom visual from Office store.
First you need to download custom visual from office store,
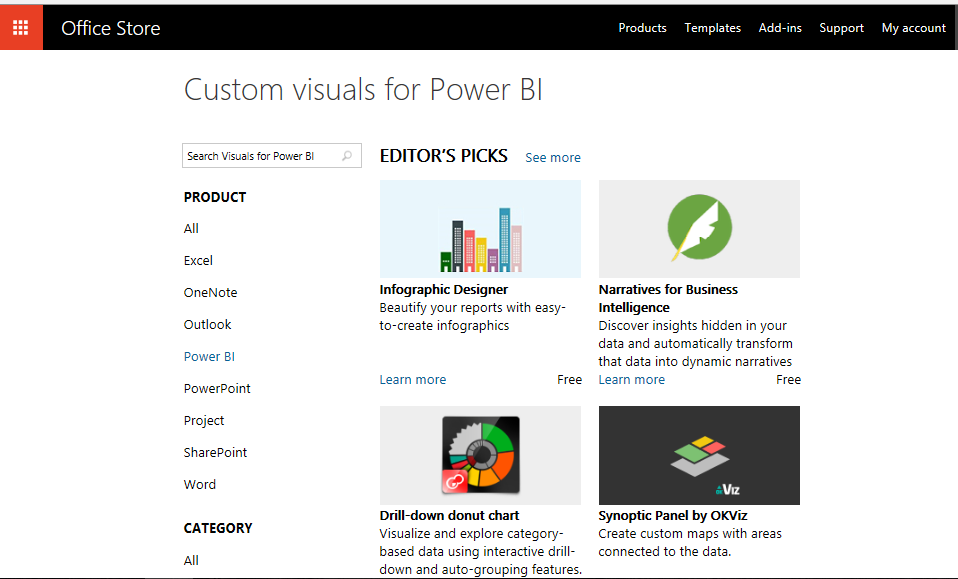
to download R custom visual please follow the below link
https://store.office.com/en-001/appshome.aspx?ui=en-US&rs=en-001&ad=US&clickedfilter=OfficeProductFilter%3aPowerBI&productgroup=PowerBI
now we are going to download some timeseries custom visuals from this website.
 in the text area type “time series” word (number 1 in the above picture). then in the right side you will see some charts.
I am going to show how we can import them into power bi and use them to show charts.
the first chart that I am going to show is a “Decomposit chart”, so what is decomposit chart?
Time series decomposition chart
As I have explained in the post one, each timeseries chart able to show 3 main concepts:
1- Trend
2- Seasonality
3-Irregular component
Trend
trend is about long-term increase or decrease in the data . for instance in the milk production we can see there is increase trend in production.
Seasonality
A seasonal pattern when data is influence by seasonal or any order. for instance, in above picture, you see in all years in the second quarter milk production is high and then in the third quarter is the lowest one (see below ), and this trend is same in all years
see as below chart, the below chart shows a timeseries object with seasonality and trend. (the chart is going up and also there is a trend in all intervals)

sometimes we want to see each of these component separatley to analysis them.
To do see, we able to decompose them to show them in separate charts.
I am going to show you how to decompose them in power bi.
imagin that we have birth rate from 1961 to 1972.
We imported data into the Power BI as below:
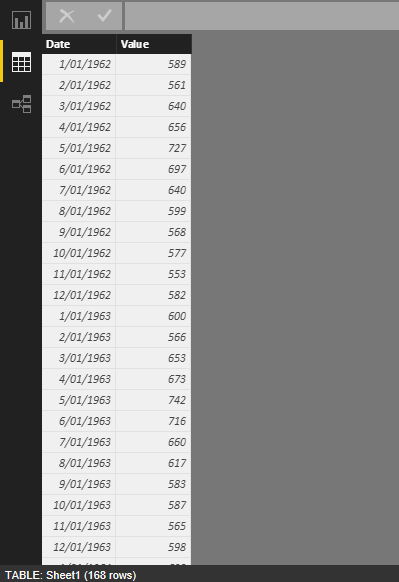
I have two columns, one for date and the other for value that is birth rate.
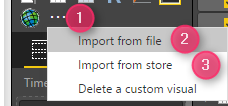
In the second step, I am going to import the custom visual chart by following the below steps.
just click on the 3 dots (see below picture), then select the “import from file”
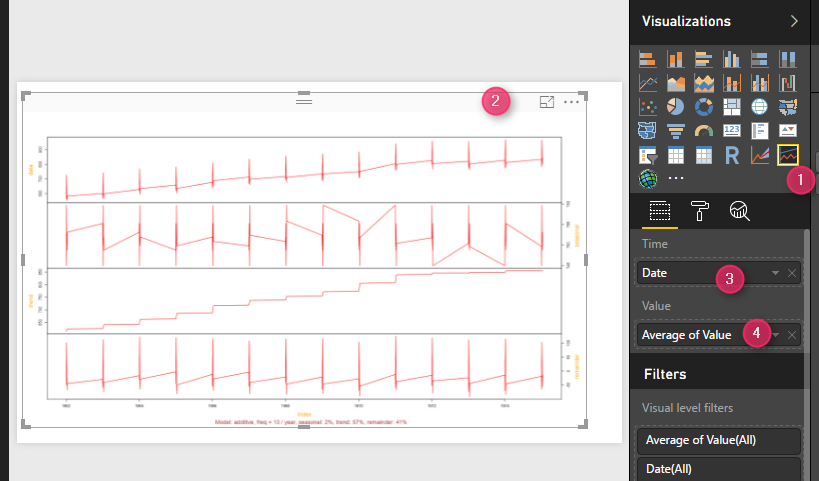
then, just import the chart into visual, and we add two values: Time and Data for the chart.
as you see in the above picture, we have four main chart, the first chart is the original time series that show the birth rate which is increasing or decreasing that we call it as trend.
In the second one, we able to see seasonality separatley, the third chart shows the trend of birth rate that is increasing. and the last on shows the irregular component of birth rate.
in the next post, I will talk about the two other custom visual chart we have inside power bi for doing the forecasting using “exponential smoothing” or “Arima”


