
In the last three parts, I have explained about the time series R custom Visual we have in Power BI. as you remember we have 3 main time series chart in Power BI store (see below): Decompose of time series (trend, seasonality and irregular components).
the two other custom visual help us to do forecasting by having Date and Value. However there are some differences between these charts, In last post, I have explained the “Exponential Smoothing”. In this and in the next post I am going to show how Arima working, and how to set up the parameters.
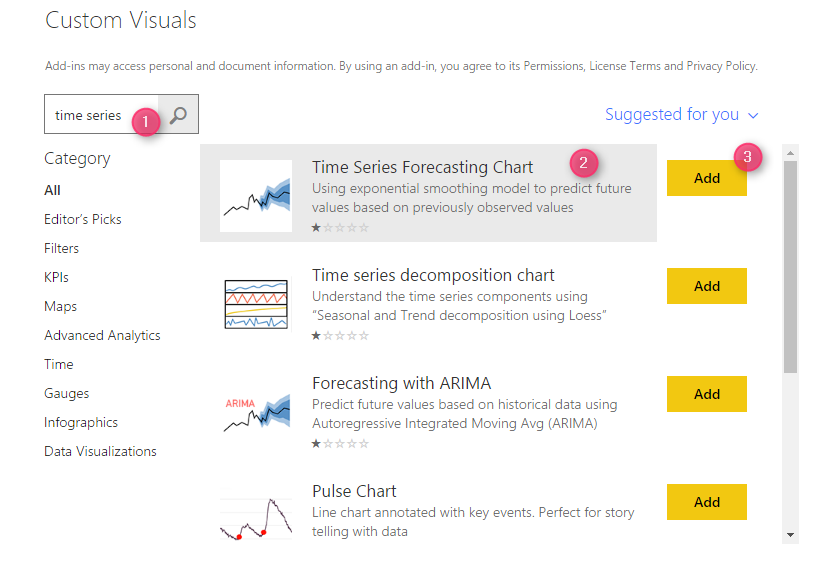
First, you need to download the chart from Power BI Store:
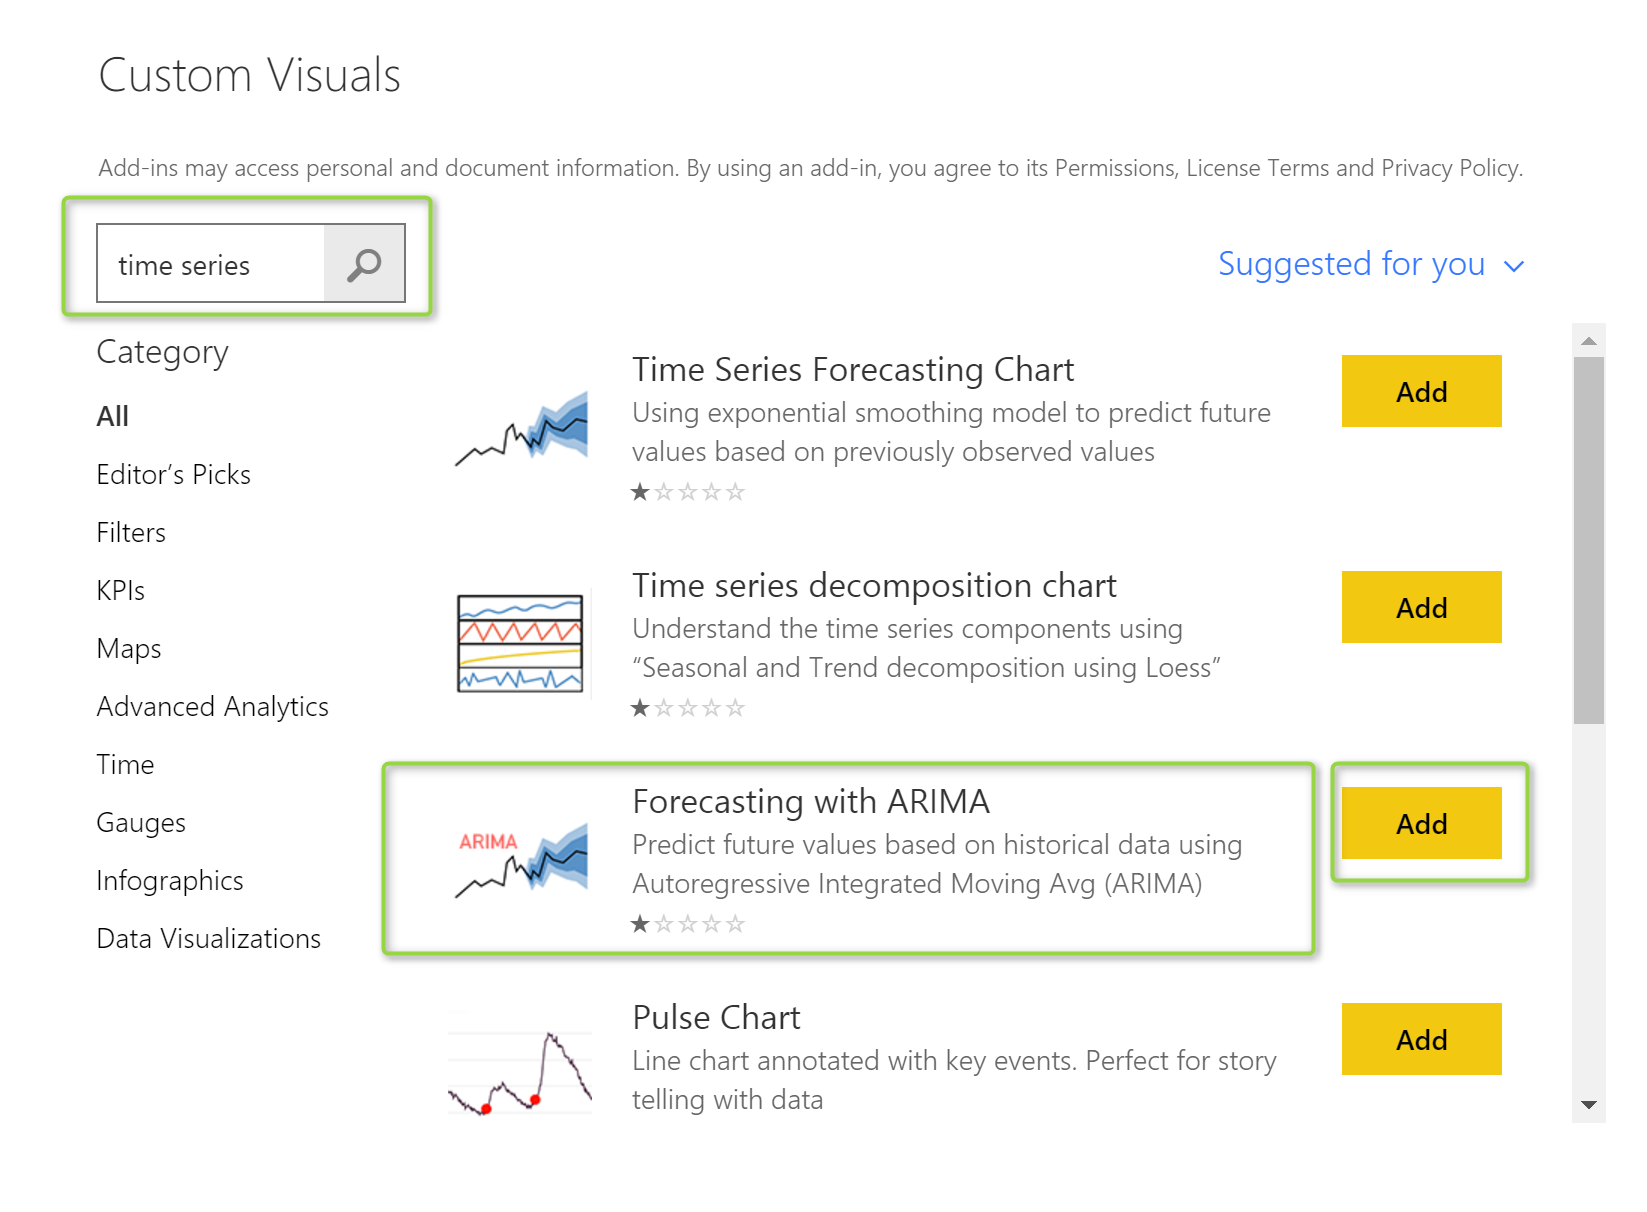
the first step is to download the Arima time series custom visual from Power BI store as below

then just select the forecast with Arima visual.
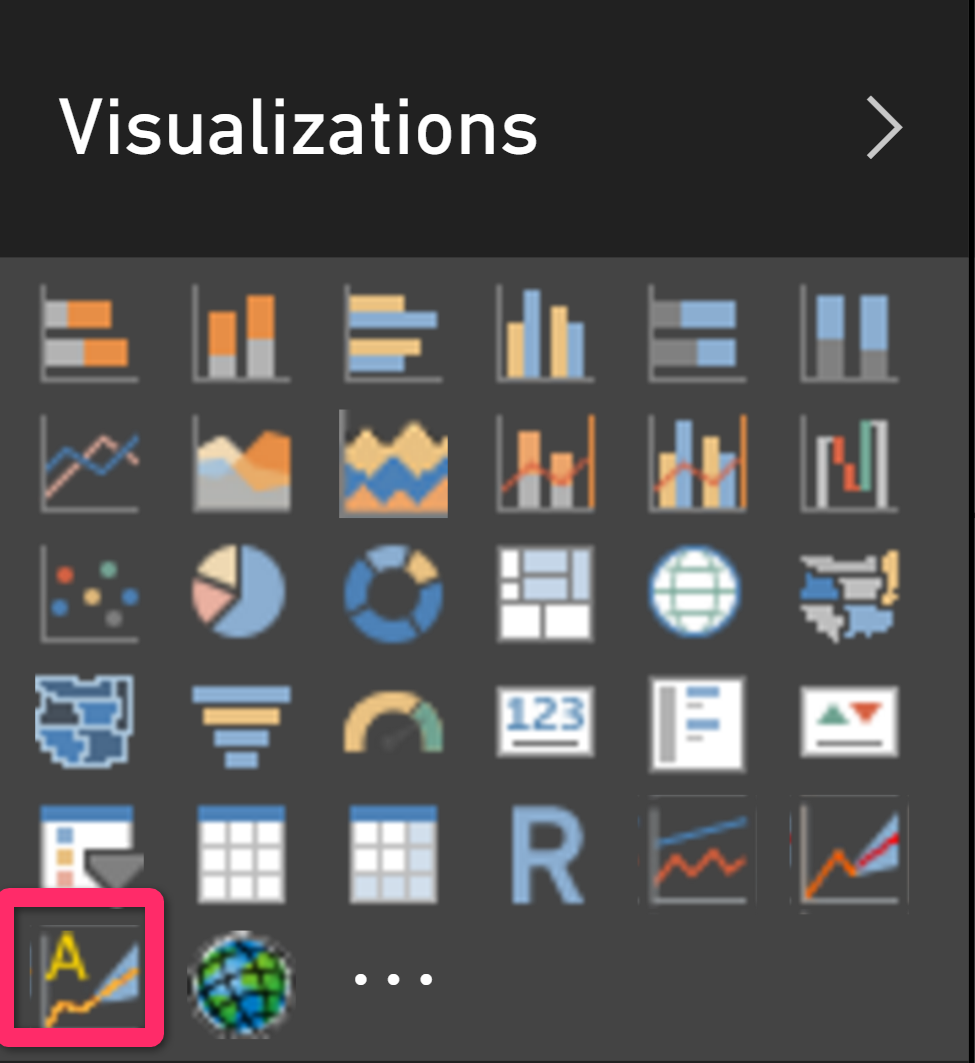
finally, you would have it in power BI as below
now I just choose two columns from my data field to see how “Arima” forecasting, able to forecast my data (see below picture)

the result is so similar with what I have in “Exponential Smoothing” forecasting chart, but the values for forecasting are not the same. Also, as you can see in the above picture, in number 2, we have some parameters that we donot have them in the Exponential smoothing. as a result, we have to set up some parameters that are not the same.
firts question come to mind is that, what is difference between “Exponential Smoothing and Arima”
Exponential Smoothing and ARIMA difference
the main basis of Exponential Smoothing was to find a relationship between current value and successive values of trend, and seasonality of data, it does not any assumption for irregular components.
While exponential smoothing models are based on a description of trend and seasonality in the data, ARIMA models aim to describe the auto correlations in the data. So what is Auto correlation in data?[3]
Auto Correlation
each forecasting may have some errors that means the difference between what happen inreal life andwhat forecast
Erorr= Real Life Data-Forecast Data
in last post about Exponential smoothing we did a forecast as below
Tempts<-ts(dataset[2],start=c(1))
#plot.ts(Tempts)
TempTrend<-HoltWinters(Tempts, gamma=FALSE)
library(forecast)
TempTrendforecasts <- forecast.HoltWinters(TempTrend, h=8)
plot.forecast(TempTrendforecasts )
As you can see in the above code we store the result of prediction in a variable name “TempTrendforecasts “.
this varibale has a component (column) name residual as below
TempTrendforecasts$residuals
so I am going to check how the errors is bad, to see how the errors (residual) is, I am going to check whether there is a correlation between forecast errors (residual) for successive predictions. if there is no correlation then this forecast is the best answer we have, otherwise, I have to use ARIMA! which I will explained later
in R we have a function name “acf()”
this chart help me to find out is there any correlation between errors for some periods (lags)
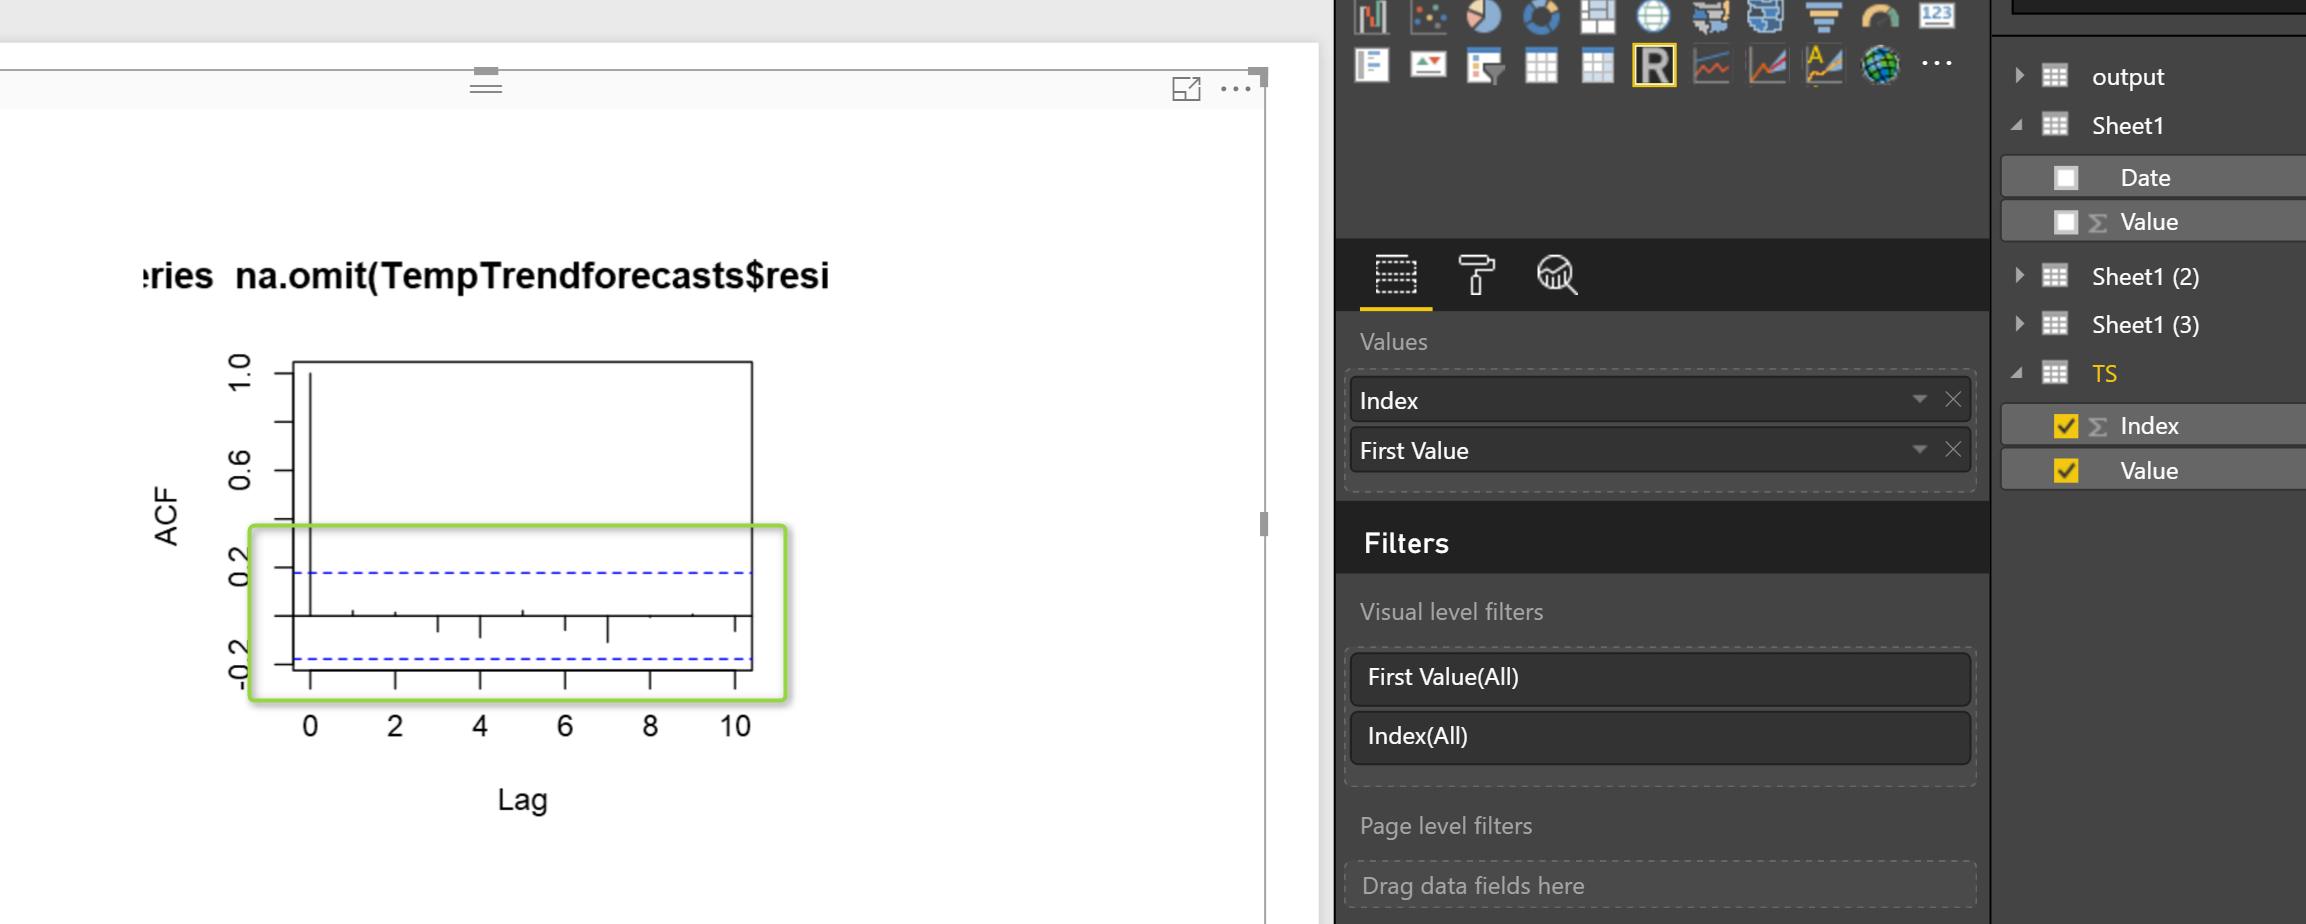
acf(na.omit( TempTrendforecasts$residuals),lag.max=10)
so the function is acf, it gets the erros lists (TempTrendforecasts$residuals), there should be no NA value in the list, so apply “na.omit” function on it to remove the NA values,
the second input that this function will get is the period that we want to check wether there is correlation between errors or not.
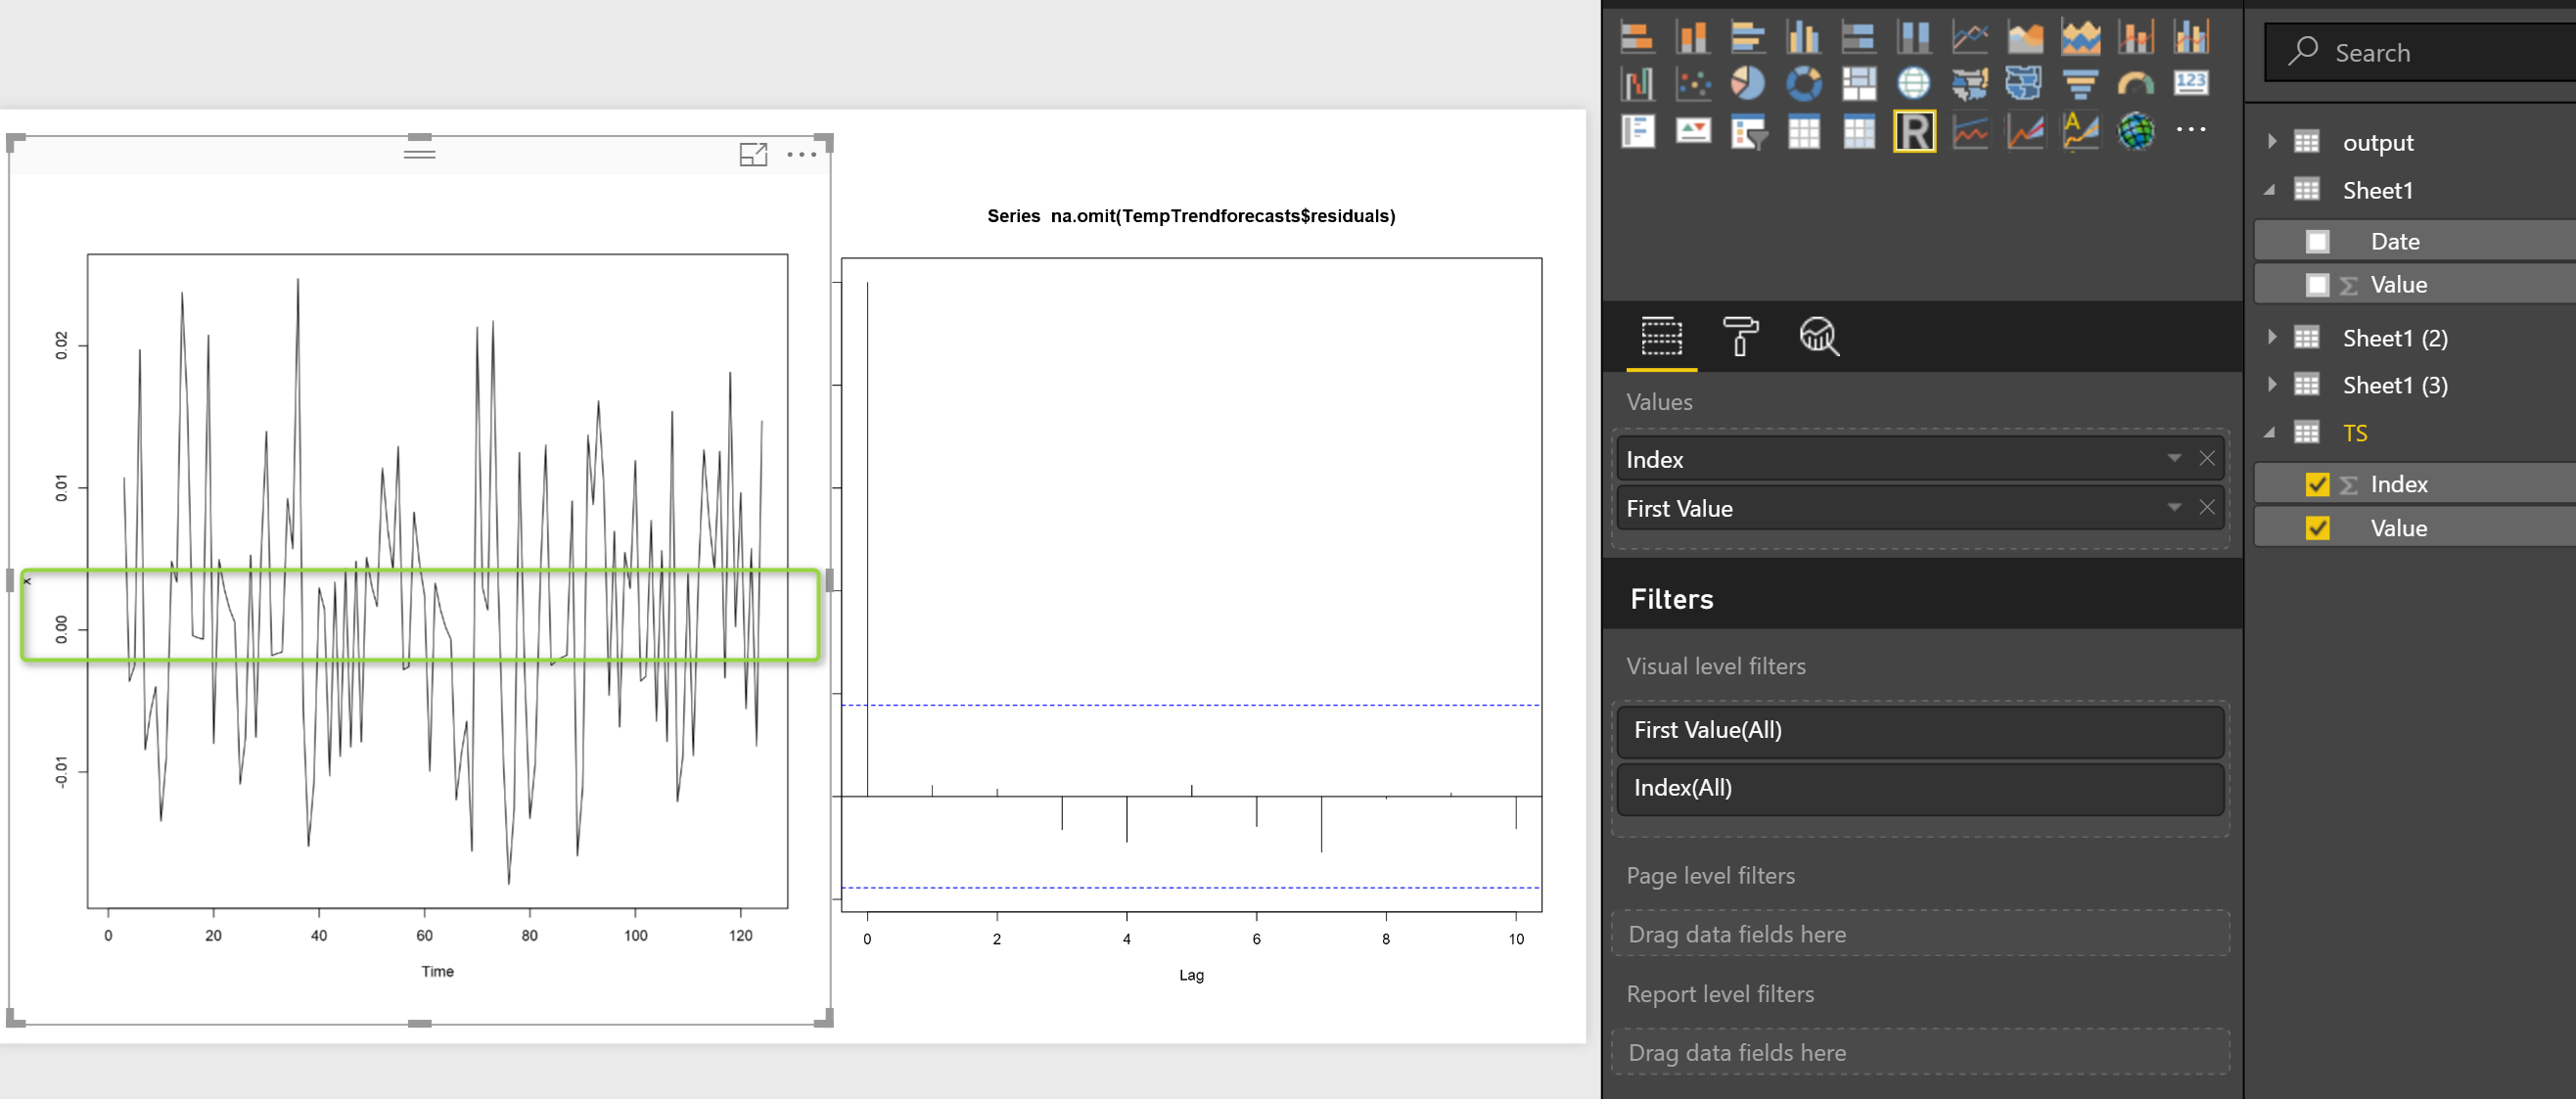
so we have below picture
in power BI we have below picture: as you see there is no that much correlation between errors for last 10 periods. (correlation is less than 0.2 that is very low correlation)
Another way to be sure that the predictive model cannot be improved , it is to check whether the forecast errors are normally distributed with mean zero and constant variance. To check whether the forecast errors have
constant variance, we can make a time plot of the in-sample forecast errors: as you see in the below picture the chart fluctuate around the Zero values. so there is no correlation between successive errors values.
However, alwyas is not like that! we have to check some other autocorrelation and testmore , there is a possibilities to have some correlation.
for next post I will explained how ARIMA will works with autocorrelation and how we set the parameters.
[1]Book:http://a-little-book-of-r-for-time-series.readthedocs.io/en/latest/src/timeseries.html
[2]https://www.google.co.nz/url?sa=t&rct=j&q=&esrc=s&source=web&cd=14&ved=0ahUKEwjIl7bUgPvVAhWLVLwKHbr2CNA4ChAWCDYwAw&url=https%3A%2F%2Fwww.ons.gov.uk%2Fons%2Fguide-method%2Fukcemga%2Fpublications-home%2Fpublications%2Farchive%2Ffrom-holt-winters-to-arima-modelling–measuring-the-impact-on-forecasting-errors-for-components-of-quarterly-estimates-of-public-service-output.pdf&usg=AFQjCNFkiCxd9yfOmyIN-MpqkRgmt_tJrA
[3]https://github.com/Microsoft/powerbi-visuals-forcastingarima


