
Although very simple, still I see many Power BI reports with no organized way of separating measures. When you use Power BI for a while, you will gradually have more DAX measures and calculations, and having them organized under folders is always helpful. In this very short article, I’ll explain how you can use Display Folders in Power BI to organize your measures properly. If you like to read more about Power BI, read Power BI book from Rookie to Rock Star.
Measures unorganized
If you have just added calculated columns and measures in Power BI solution, your file will look like this in Power BI Desktop:
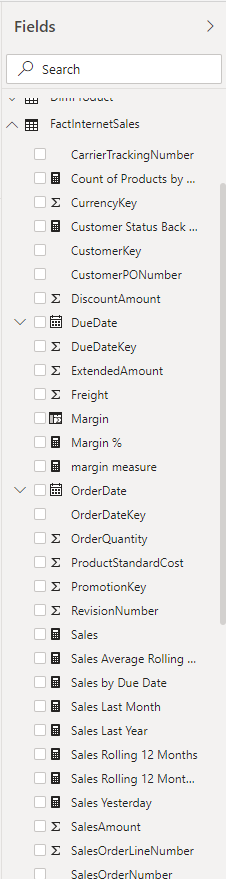
And this is an example of a file with only a few measures. I have seen examples with over 100 measures under a table. You can use the Search box of course to find something, but having them organized is always helpful.
What is the Display Folder?
It is simple to add a display folder in Power BI. Display folder is a virtual folder which can be used for fields (columns), calculated columns, and measures to group them together. Here is how a display folder looks like:
Creating Display Folder
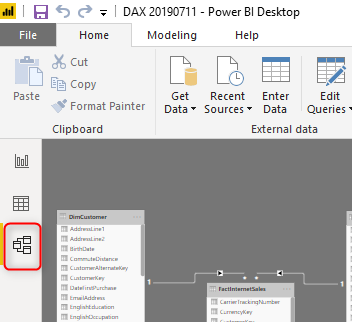
One of the easiest ways to create a display folder is to go to the Model tab in Power BI Desktop.
Then select a column, measure, or calculated column (you can select multiple items using Ctrl+Click), then under Properties, you will see the Display Folder
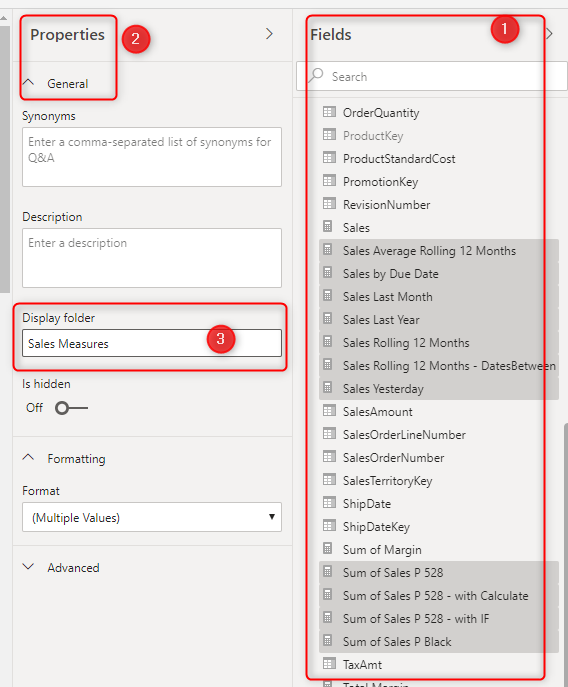
As soon as you press Enter, you will see all of those measures (and/or columns) under a folder under that table:

Subfolder
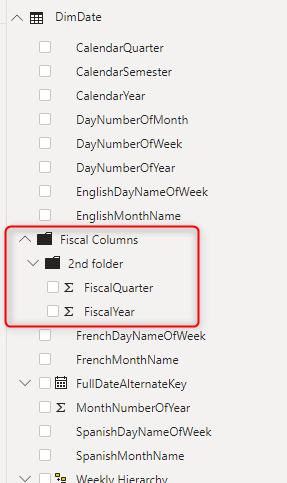
If you want, you can create subfolders too. The way to create it is to put a \ in the display folder name, here is an example:
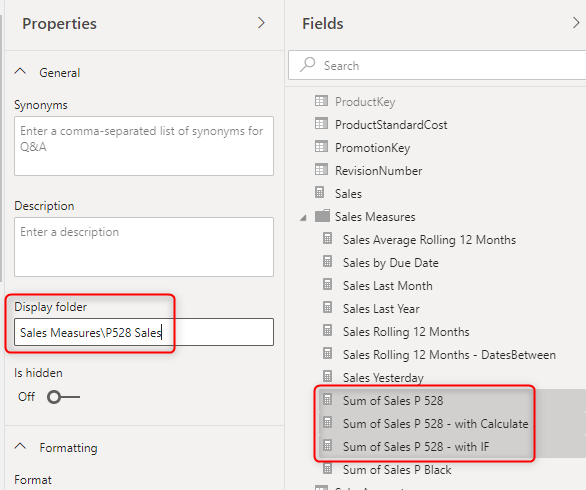
and this is how it will look like:

Measure Table
Each measure should be part of a table, however, that table would be like a placeholder only for that measure. Because the calculation of the measure would work regardless of which table it is located under. So it means that it really doesn’t matter which table you put your measures under, however, there are two approaches for this:
Put measures under their related tables
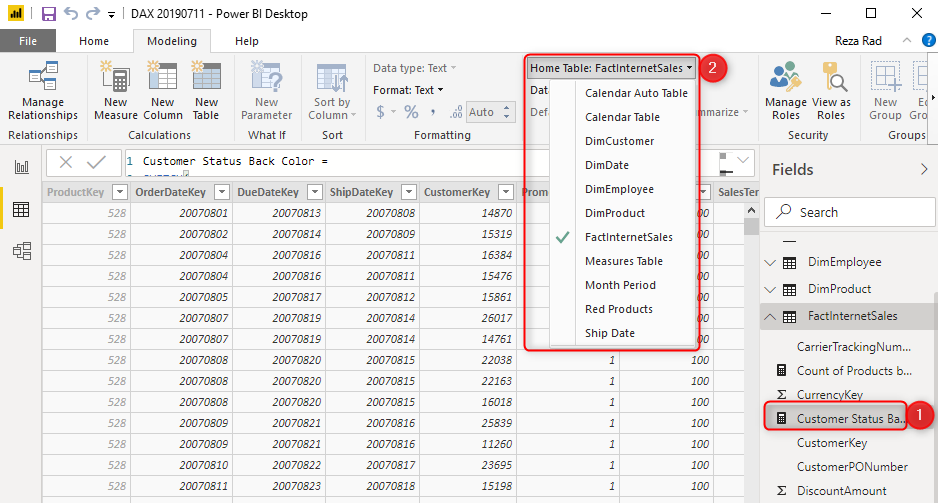
One approach is to put sales measures under Sales table, inventory measures under Inventory tables, etc. If you want to move measures from one table to another table, here is how you can move it:
Select the Measure (either in the Report tab or Data tab), then from the Modeling tab above, change the Home Table:
Put measures under a measure table
Another approach is to create one (or more) blank tables with no columns or fields, and then move all measures under that. Here is more explanation about it.
Summary
Having an organized list of measures is super helpful in further maintenance of your Power BI model. It is a simple work that saves you a lot of time in the future. Using tools such as Power BI Helper is also helpful to understand your model and DAX measures much more in details. Do you use the display folder or measure tables? if not, please let me know why, if yes, tell me down in the comments below how do you use it.


Reza is author of more than 14 books on Microsoft Business Intelligence, most of these books are published under Power BI category. Among these are books such as Power BI DAX Simplified, Pro Power BI Architecture, Power BI from Rookie to Rock Star, Power Query books series, Row-Level Security in Power BI and etc.
He is an International Speaker in Microsoft Ignite, Microsoft Business Applications Summit, Data Insight Summit, PASS Summit, SQL Saturday and SQL user groups. And He is a Microsoft Certified Trainer.
Reza’s passion is to help you find the best data solution, he is Data enthusiast.
His articles on different aspects of technologies, especially on MS BI, can be found on his blog: https://radacad.com/blog.
Hi, thanks for this, I learned that it is better to put measures for Sales in the Sales table for better performance with Q and A? Is this right or there is no difference? Thank you!
Hi Suzan
You will get better Q&A experience with measures not in a separate table of course.
Cheers
Reza
Hi Reza,
Thanks for this great tip.
Is there a way we can put table/queries into separate folder schema wise.I mean Purchase related queries goes to Purchase folder and Sales related queries goes to Sales folder.
Thanks
Unfortunately not yet, We can create folders for tables in Power Query, but not yet in the fields section of Power BI Desktop
Cheers
Reza
Hi Reza,
This is an amazing article, I am doing this for all my development.
But recently I found an issue with Export underlying data is not working when use Measures in groups.
Here is the link, that I posted for the same issue.
https://community.powerbi.com/t5/Issues/Export-underlying-data-returning-only-totals-row/idi-p/706075
Thanks for your response.
Yes, and that is one of the reasons I don’t usually go with the Measure tables approach myself.
However, it would work fine with display folders
Cheers
Reza
thanks , it is very use full information ,
What i do is Make a table(name it as measure) where is one column then i add all the measures in it and delete that one column also so the measure table comes at top of list. and all the measure are at one place does that will effect performance of measure
creating a measure table is good practice. but I doubt if it changes the performance of your measures. measures are calculated only when in the report. it doesn’t matter which table they belong to.
Thank you – this tip was very helpful
thx for the info!