
In the last posts, I have explained about some main concepts of Time series. How to decompose time series that has irregular, trend and seasonality components have been explained in: seasonality component decompose).
now image we have a dataset that does not have any seasonality also does not show a clear trend.
This data is about the age of death of kings from https://robjhyndman.com/tsdldata/misc/kings.dat
We have to read the data using scan function :
kings <- scan("http://robjhyndman.com/tsdldata/misc/kings.dat",skip=3)
now, I am going to convert the data into a time series object using “TS” function. Then I am using plot.ts() to show the data
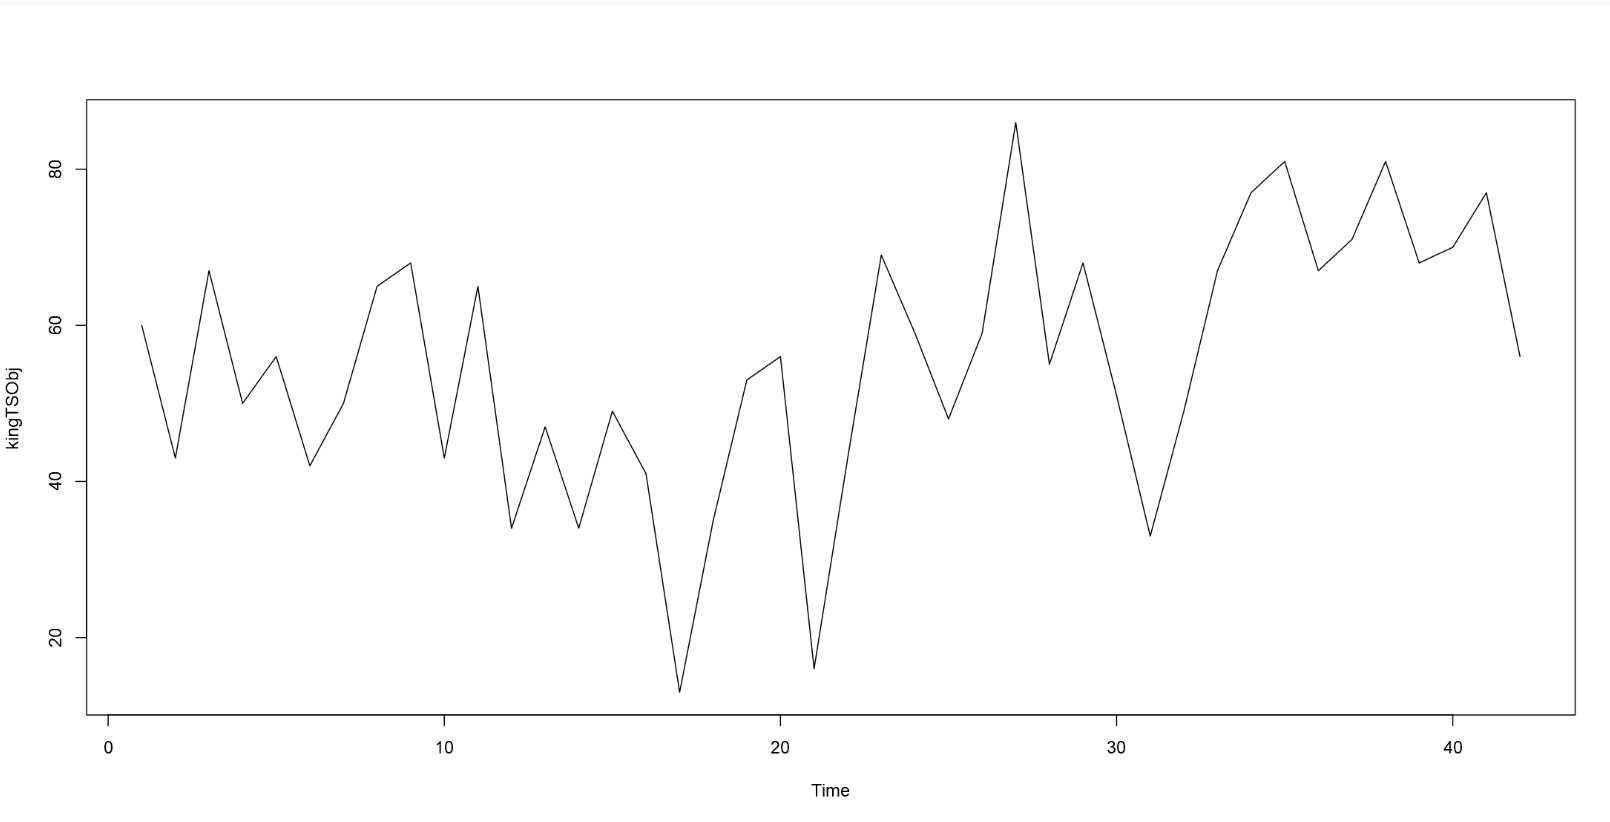
kingTSObj<-ts(kings)
plot.ts(kingTSObj)
The result of running the code will be below image:
as you can see, there is no seasonality in data, just a none clear trend, and irregular components.
Normally, to have a clear image of “trend” of data, we use”Smoothing approach”, Smoothing usually use to better see the trend of data. We use this approach to smooth the irregular components to remove the irregular components.
Simple moving average
SMA, is about calculating the average of data for specific time span,
let explain the concept by below example” we have a data as:
Daily Closing Prices: 11,12,13,14,15,16,17
so for each day we calculate the average of last 5 recent days
First day of 5-day SMA: (11 + 12 + 13 + 14 + 15) / 5 = 13
Second day of 5-day SMA: (12 + 13 + 14 + 15 + 16) / 5 = 14
Third day of 5-day SMA: (13 + 14 + 15 + 16 + 17) / 5 = 15
in R there is a package that helps us to smooth the data
install.packages(“TTR”)
library(“TTR”)
I am going to smooth the data with 3 past data point we have as below
library("TTR")
	kingsTSSMA<-SMA(kingTSObj,n=3)
	plot.ts(kingsTSSMA)
However after running the code, you will see the chart is not that much smoother, so we need to consider more data span, entries 5 and 6. but finally 8 spans make the chart more smooth
 kings <- scan("http://robjhyndman.com/tsdldata/misc/kings.dat",skip=3)
kingTSObj<-ts(kings)
library("TTR")
kingsTSSMA<-SMA(kingTSObj,n=8)
plot.ts(kingsTSSMA)
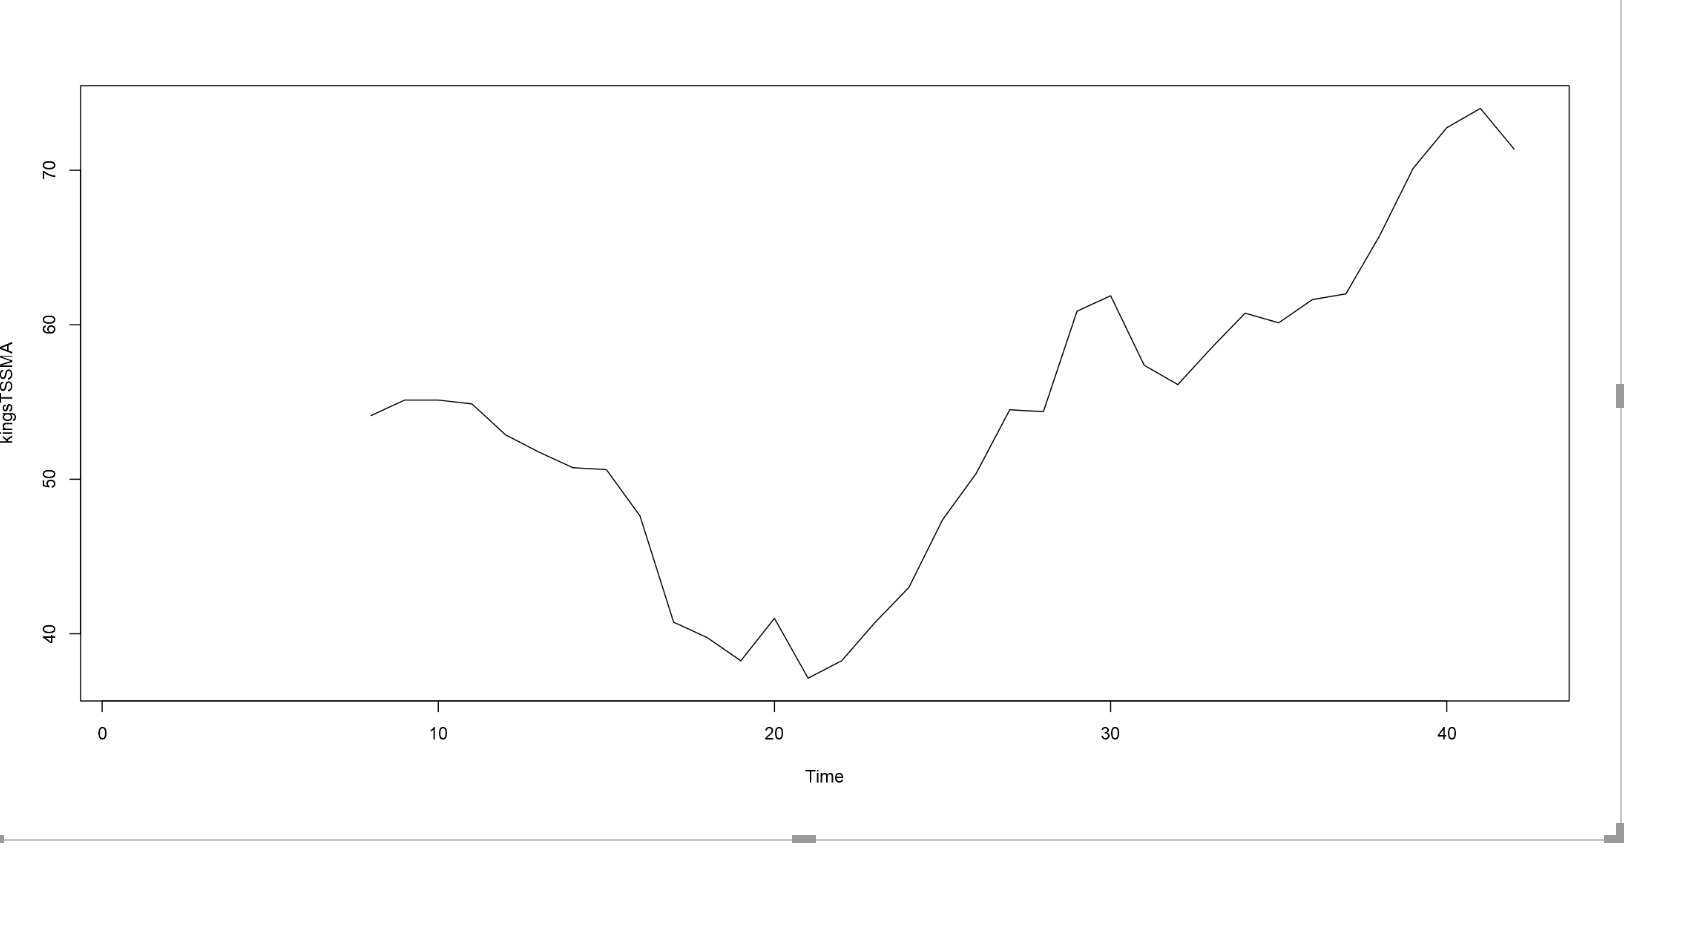
so know we able to see the obvious increasing trend in data without any irregular components
reference: http://radacad.com/new-series-of-time-series-part-1
http://a-little-book-of-r-for-time-series.readthedocs.io/en/latest/src/timeseries.html
https://onlinecourses.science.psu.edu/stat510/?q=node/70


