
Bookmarks are a way of storytelling, There are many examples of using Bookmark to show narrative storytelling check Reza Rad blog post on “Bookmarks and Buttons“.
Imagine you created several bookmarks from different pages you have in the Power BI file. however, not all bookmarks are related to the same story.
One related for example to annual sales another talking a tory about potential customers. all bookmarks will be shown in one panel and if you click on the View, you will see all bookmarks, no matter how they are connected! In this blog post, I am going to show you how to group bookmarks, to better tell a story.
Current Report
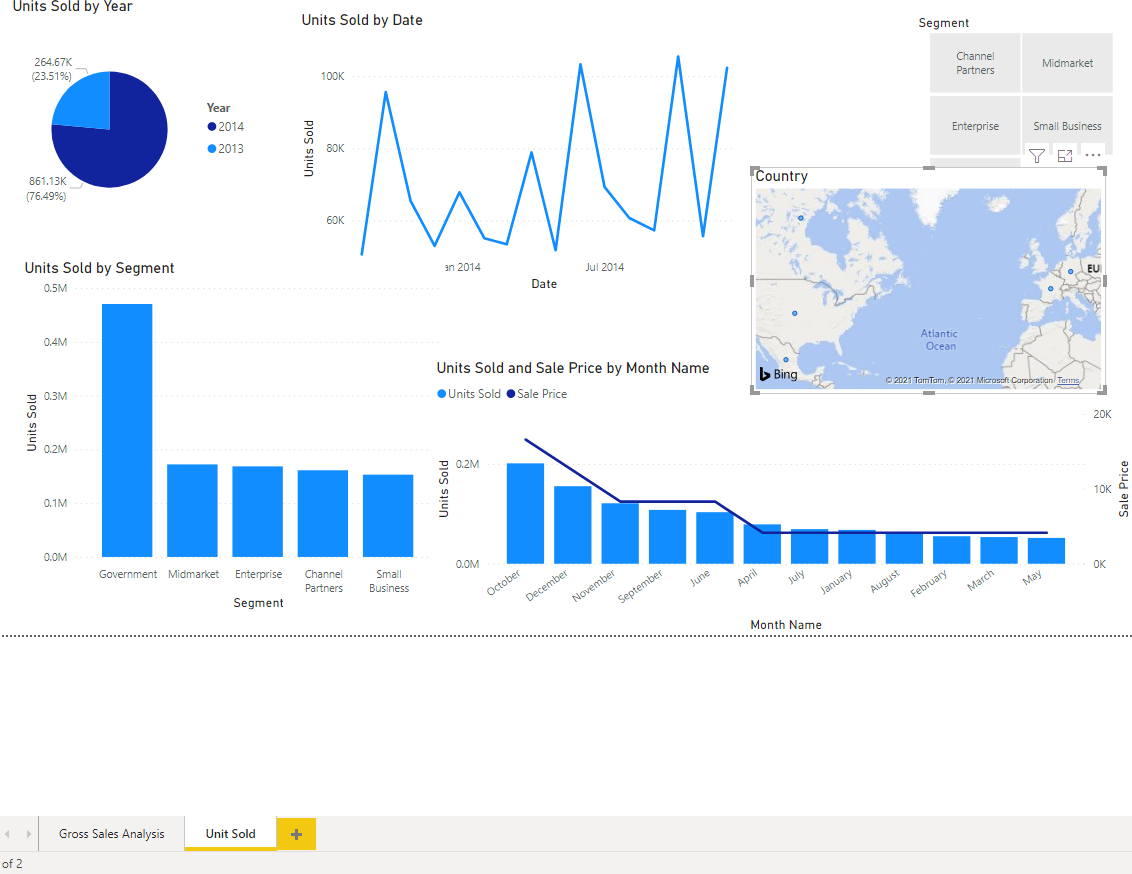
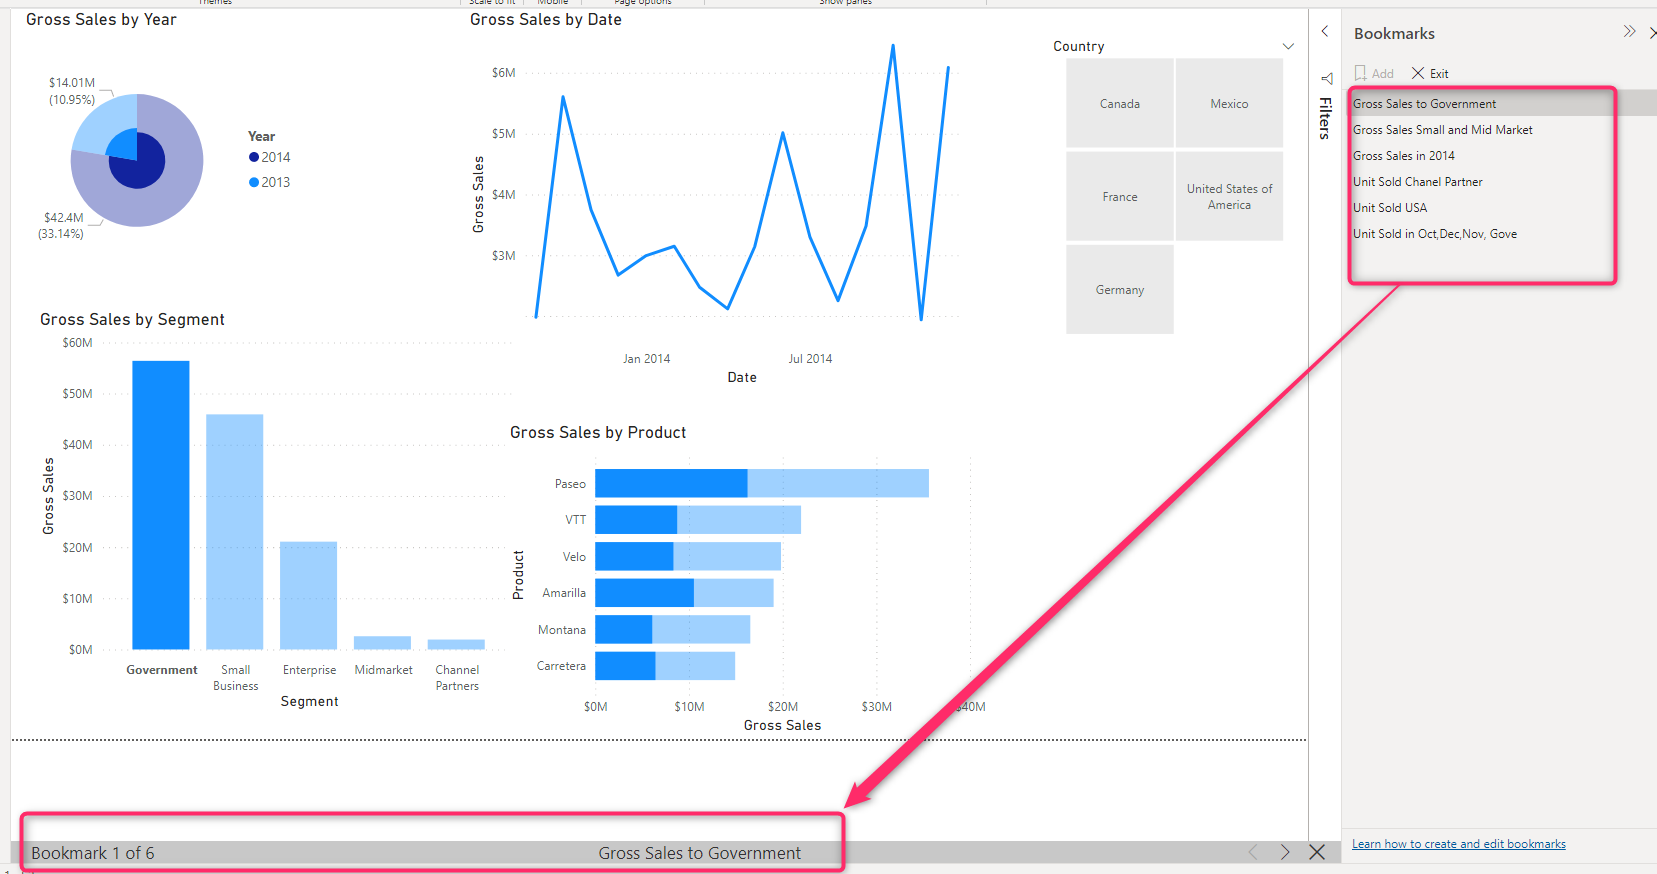
I have two pages report based on the financial dataset ( sample dataset in Power BI). One page presents the Gross sales of a product and the other shows Unit Sold to the customer. Below Picture
I want to tell a story about gross sales and unite sales for different audiences. To this aim, I created some bookmarks to show in my presentations ( Below screenshots).
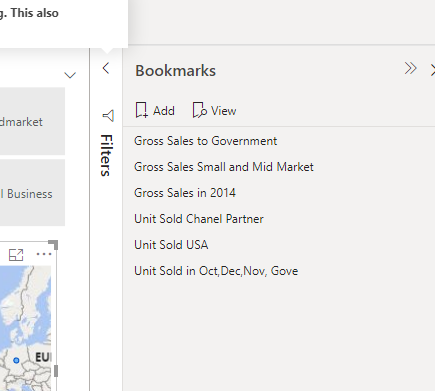
If I follow the normal way of showing Bookmark, click on the View in Bookmarks tab you will see all six bookmarks will be shown to the user, which I want to show only three bookmarks to one Marketing team and the UnitSold to Production teams
I am going to create a Grouping in Bookmarks Panel as below: make sure you are not in view mode, then, select one of the bookmarks you created, then click on the three dots, group.
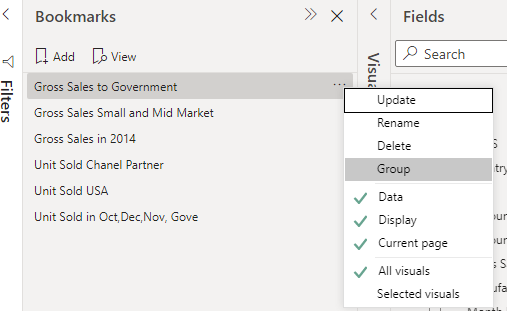
Now you have a group 1, you rename it and add other bookmarks to it.
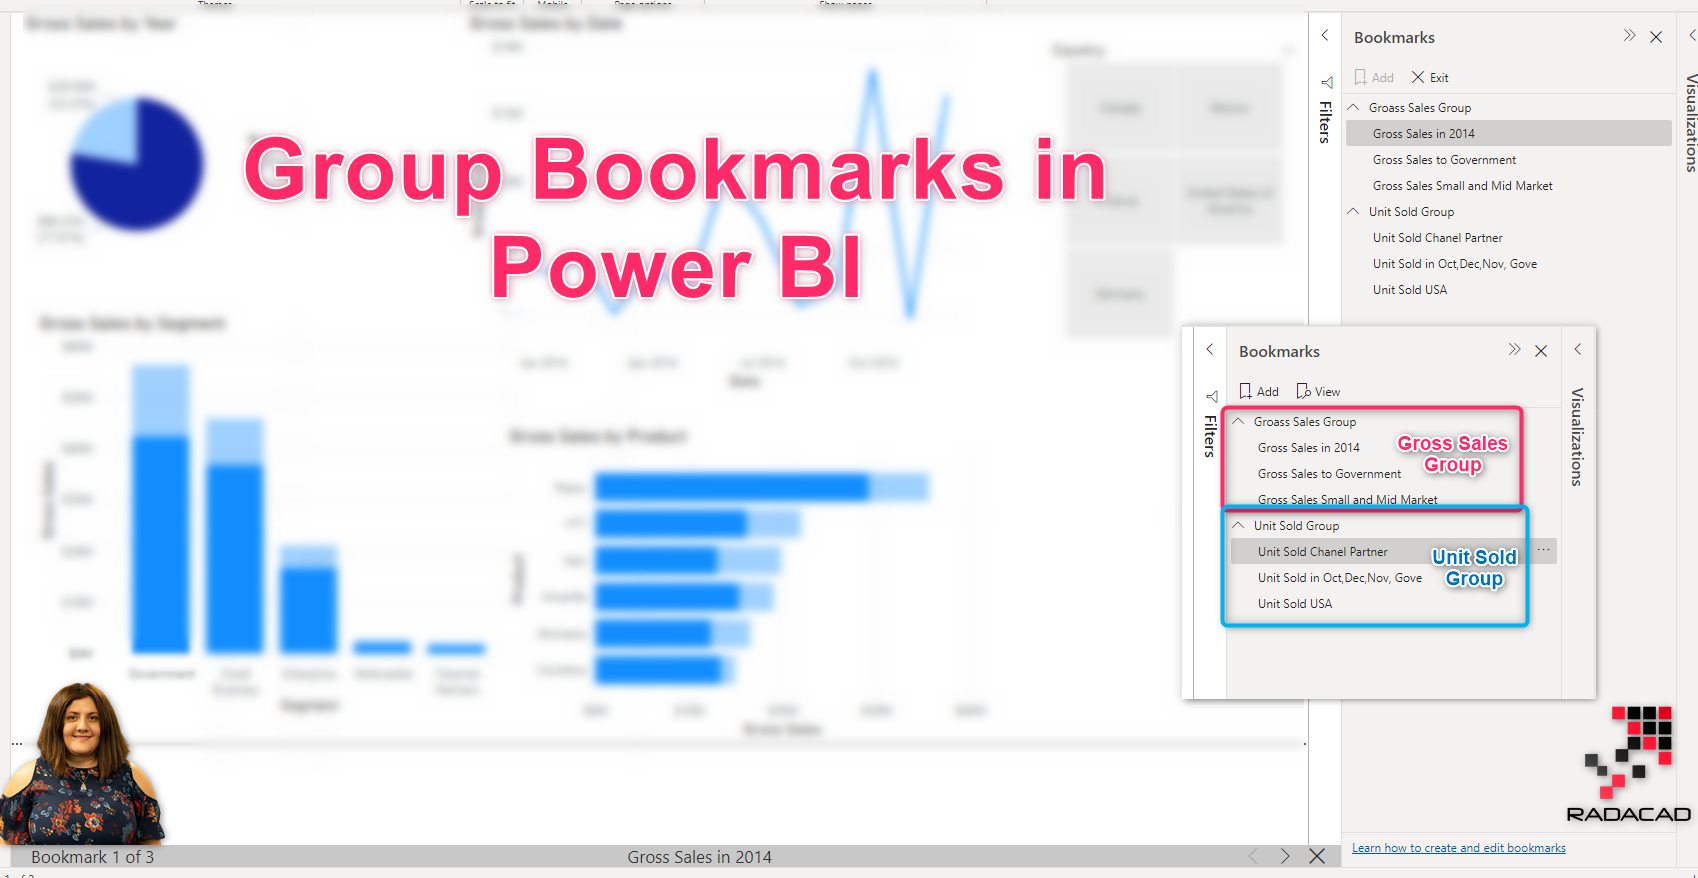
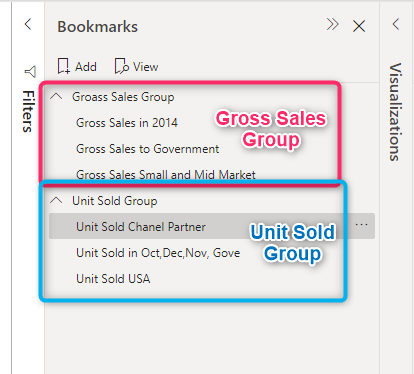
To rename it just double click on group 1, and change the name to “Gross Sales Group”, then select other gross sales bookmarks and drag them under the Gross Sales Group, Make sure first expand the Group then drag them there. Do the same for Unit Sold. the final view should be as below screenshot.
Now Lets View
Click on one of the Gross Sales Group, then click on the view.
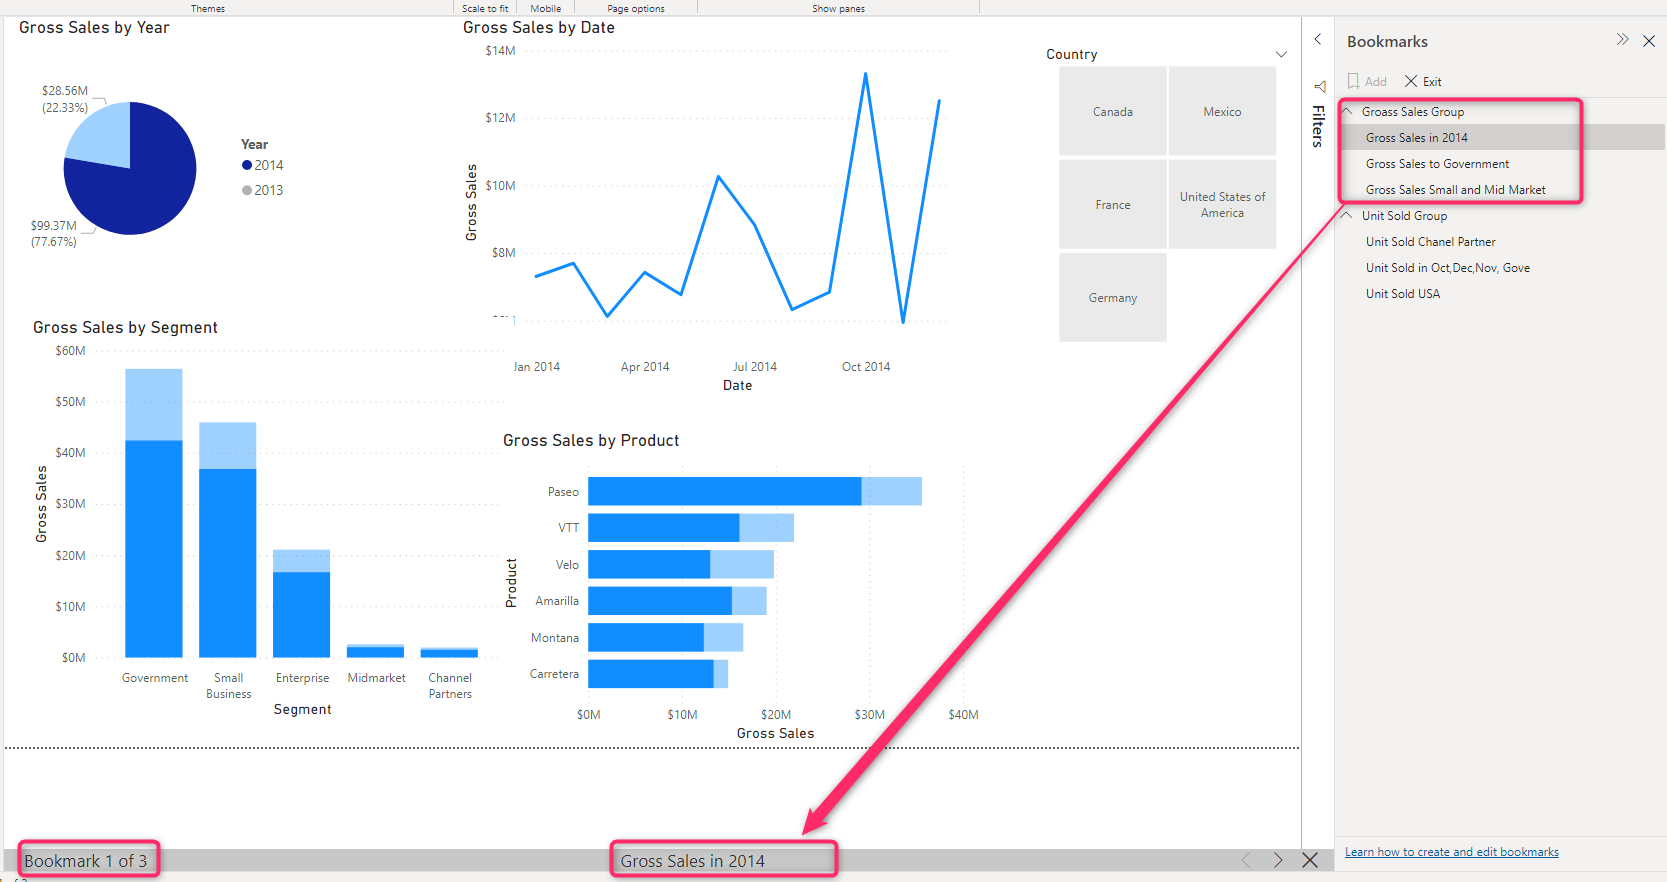
As you can see only three bookmarks are available to view, from 6 available bookmarks


