
In the previous post, you’ve learned what Power BI Desktop is, and how it can be used for getting data and also doing visualization. We used the Pubs sample dataset for that example. In this post, we continue the same example, with a touch on modeling and also more visualization. This post is part of the http://radacad.com/online-book-power-bi-from-rookie-to-rockstarPower BI book from Rookie to Rock Star.
Prerequisite
You should have done step one of this exercise from here:
Power BI Desktop; Getting Started – Part 1
Your example in the previous step should have ended with on the screenshot below;

Treemap; Adding the next visual
So far, we created only one chart in our visualization panel. Now let’s add the second visual. For the second visual, let’s select Treemap. Before selecting this new visual, make sure that the visual is not selected, the from the visualization panel, select Treemap.

From the Fields panel, drag and drop qty from the Sales table, and type from the Titles table into the visual like the screenshot below;

As you can see, In Power BI Desktop, building visualization is very easy. It is as easy as dragging and dropping.
Interactivity of Visuals
Visuals in a Power BI report are interactive, and you can use them for slicing and dicing one another. For example, by clicking on the psychology section of the Treemap, you will see titles that fall into that category will be highlighted in the Column chart.

This interactivity is the nature of objects in Power BI. However, you can change the interaction if you like. To select an item, click on it (like the above example). If you want to unselect it, click on it again.
Now let’s see an example which is a bit different.
Calculations
So far, we have used Qty in our analysis, let’s now build a visualization with Sales Amount. The fact is that we do not have a field for sales amount in our dataset! However, we do have Qty from the Sales table, and the Price from the Titles table.

We can create a calculation driven from these two columns. Let’s keep it simple, just qty multiplied by price is what we want. Let’s see how and where we can write this calculation.
In the left-hand side tabs, select Data tab.

In the Data tab, you can see the data values in each table and column. By selecting the table on the right-hand side, you can see the data of that table. However, you cannot edit the data here. Power BI is not a tool for editing the data. You can change the data in the data source (if you like) and then hit the refresh button in Power BI Desktop to get the change coming.
Data Tab gives you some information about data rows in each table and also is one of the places that you can write calculations. In this example, we want to add a calculated column in the Sales table and name it as Sales Amount.
In the right-hand side from the list of tables, select Sales, and then from Modeling tab, click on Add New Column.

When you click on the New Column, you will see a new column appears, and a formula bar (very similar to the formula bar in Excel) comes up. This is the formula bar to write your expression. However, the expression here is different from the Excel formula. It is with a language called DAX (Data Analysis eXpression), we will talk about the structure of this language much more later on. For now, just a simple example is what we are after. Let’s call the column; Sales Amount (change the “Column” before the “=” sign, to “Sales Amount”). Note that the column name can have spaces in it. It is always a good idea to write column names that are self-explanatory, and avoid underscore or abbreviations. When you create a Power BI model, you are creating it for users and data analysts, so be descriptive in names of tables and columns.

Unlike Excel you cannot click on columns to add them in your expression, you have to type the name of columns when you type column names, you can see an intellisense comes up. You can select the column from there with the Tab key in your keyboard.

The column name usually enclosed with square brackets, and before that comes the table name. Our expression should be qty multiplied price. However, when you type price, you see the intellisense doesn’t bring that in the list.

The intellisense in DAX is very smart. When it doesn’t show the item in the list, it most probably means that you cannot use it there. Even if you type the value itself, you’ll get an error. The reason that you cannot use the price column here is that price is not a column in the Sales table. Price is a column in the Titles table, and there are multiple rows in that table, means there are multiple price values there. If you want to get the price of the title which is related to the sales table, you have to use some functions. One of these functions is Related. Related is a function that returns a field from a related table. I will explain this function, and other DAX functions later in other posts.
When you type the related, then inside that as a parameter, you can choose the price column from the titles table.

Here is the full expression for the Sales Amount;
Sales Amount = Sales[qty]*RELATED(Titles[price])

As soon as you press Enter, the expression evaluates for each row in the table, and you will see the sales amount calculated and visible for all rows.
You can also see that the Sales Amount column is now listed as a column under the Sales table, with a specific icon that shows this is a calculated column. Now let’s do some formatting for this column.
Field Formatting
Besides the formatting for every visual, you can also format every field. The field formatting includes the data type, and also the format that the value of that will be showed in the report. For example, you can set the format of a field to be currency. Select the Sales Amount column that you have created in the previous step, then go to the Modeling tab. You will see formatting options like the screenshot below;

Set the format of this field to Currency General. Currency general means the currency of your machine, In my case, would be the New Zealand dollar, and you can also set the decimal places to two or whatever you like. You will see the values of this column will change accordingly.

More Visualization
Now that we have created the Sales Amount column let’s create a visualization with that. Go back to the Report tab. Drag and drop the Sales Amount into a blank space in the report canvas, and then add a title from the Titles table to it. The screenshot below shows a glance of this visual;

As you can see the Y-Axis have the sales amount with the $ sign beside it because this is how it configured on the field level.
Card Visual
As another visual, let’s add a visual that shows only the total sales amount. When you want to show one single value only (text, date, or number), Card visual is one of the best options for that. You can see Card Visual in the list of visuals with the icon that has 123 on it.

Drag and drop the Sales Amount to this visual. You will see the total sales amount in our small dataset.

Slicer
One of the main benefits of using Power BI reports is the interactivity of the report for the audience. One of the aspects of this interactivity is a filter on the page, which users can choose items from it, and it immediately filters all the visuals on the page based on it. The type of filter I mentioned is called Slicer. Slicer is one of the visuals in the visuals panel.

After adding this visual, you can bring any fields to it to acts as a filter. Let’s say; you want to filter by the order date. There is a field named Ord_date in the Sales table. Let’s first rename it to a better name, double click on this field to rename it to Order Date.

Now bring Order Date field onto the slicer. You will see a date range slicer like below screenshot;

Now with changing the range of slicer, you can see the whole report changes.

To clear selection of the slicer, click on the clear button on the top right-hand side of the slicer.

Adding Header
You can add an image as a logo to this page, and also text as the title of the page. To add the logo, in the Home tab, click on Image, and choose the image you want.

You can also see the Text box right above the Image option, and add that for the title of the page.
Here are the image and text that I used for the title:

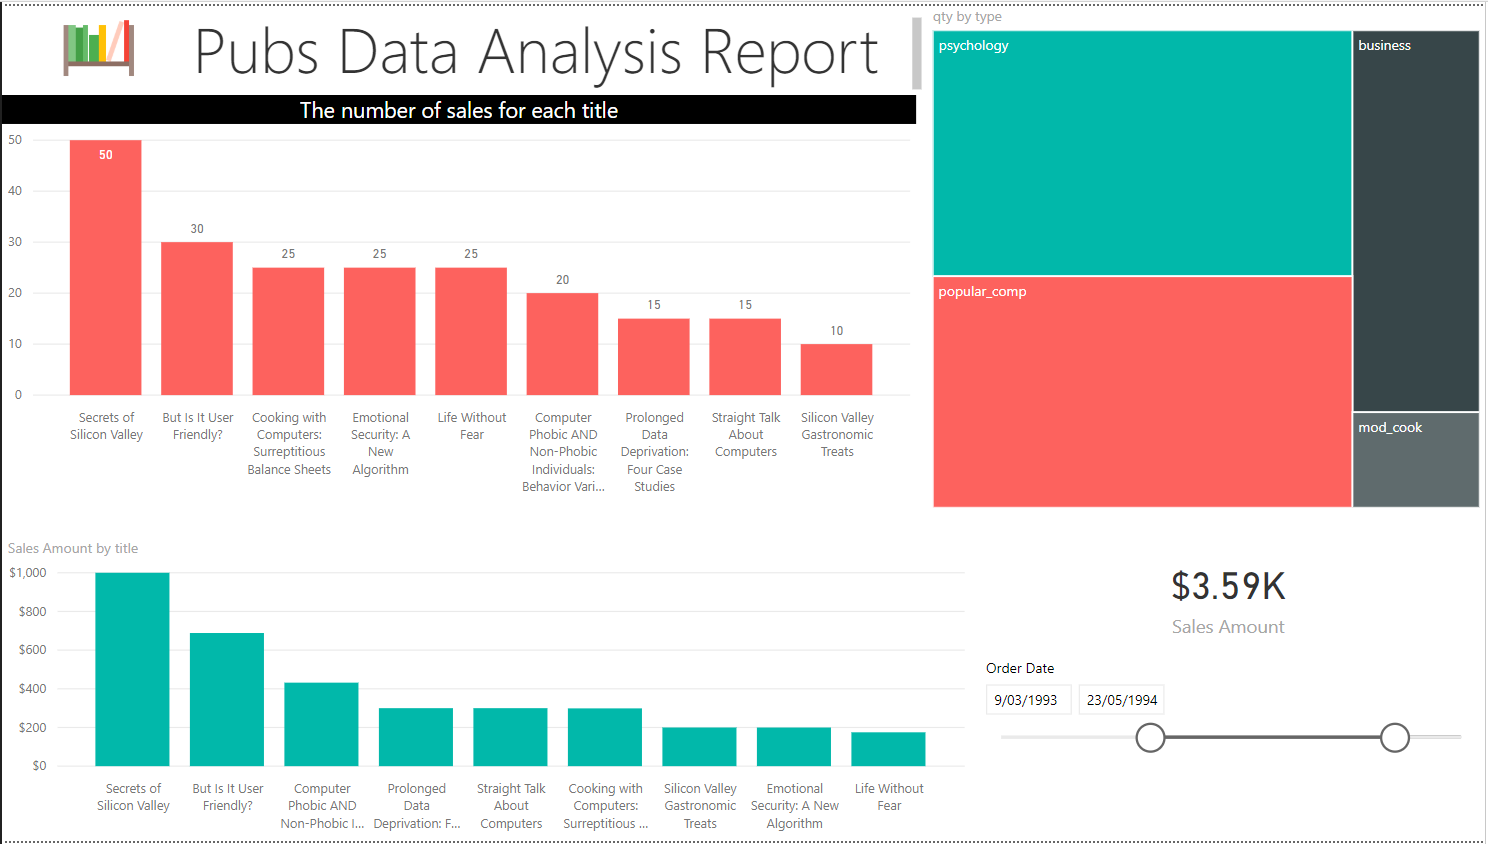
The Final Report
The final report looks like the below screenshot now. In the next step, I will explain how to publish this report. Make sure to save it for the next step.
When you save a Power BI Desktop file, it becomes a file with the extension of *.pbix. This file in our case include data as well (there are other ways of connection in the Power BI Desktop, which doesn’t keep the data). If you share the file with someone, they would be able to see the data and the report. However, they do need to have Power BI Desktop install. Power BI Desktop is not a tool for users; it is a tool for developers. In the next post, I’ll explain how to use Power BI website (service) to share the report with users.
Summary
Power BI Desktop is a tool for developers and reports builders to build the data model and report as they want. Power BI Desktop is a free tool that can be installed only on Windows operating system at the moment. As you have seen in this post, Power BI Desktop has different components; a component to get data, another component to build a model (relationship, calculations), and a component for doing visualization. All components are embedded in Power BI Desktop seamlessly that you can create a solution end to end simply with that. In the next post, I’ll explain how to publish the report created in the desktop into the website and share it with others.


Reza is author of more than 14 books on Microsoft Business Intelligence, most of these books are published under Power BI category. Among these are books such as Power BI DAX Simplified, Pro Power BI Architecture, Power BI from Rookie to Rock Star, Power Query books series, Row-Level Security in Power BI and etc.
He is an International Speaker in Microsoft Ignite, Microsoft Business Applications Summit, Data Insight Summit, PASS Summit, SQL Saturday and SQL user groups. And He is a Microsoft Certified Trainer.
Reza’s passion is to help you find the best data solution, he is Data enthusiast.
His articles on different aspects of technologies, especially on MS BI, can be found on his blog: https://radacad.com/blog.