
Power BI is not only a solution for small datasets, but It also caters for big datasets. If the volume of data is huge, you can switch to DirectQuery mode. Because DirectQuery does not store a copy of that data in the memory of the machine that runs the Power BI model, then Power BI will send queries back to the data source for every page rendered in the report. If you want to learn more about Power BI, read the Power BI book from Rookie to Rock Star.
DirectQuery mode, however, is slow. Consider a page with three, four, or five visuals. That page will send five queries to the data source with every change in the filtering context, such as changing the slicer, clicking on a column chart to highlight part of it, or refreshing the page. Sending queries to the data source for every interaction makes the DirectQuery mode very slow. Because of that, DirectQuery is the last recommended way of connection in Power BI. I have written a blog post about the comparison between connection modes in Power BI, and my suggestion is always to use DirectQuery as the last hope when other methods cannot be used.
Video

You may have heard of another type of connection in Power BI called Composite mode. I have already written a blog post, which you can read here. Composite mode allows part of the model to use DirectQuery (for large tables) and part of the model to use Import Data (for smaller tables). This way, you can get better performance when you work with smaller tables because they are querying the in-memory structure of the data.

However, the table(s) that is part of the DirectQuery connection is still slow. The composite mode comes with a fantastic feature called Aggregations. Aggregations are the solution to speed up the DirectQuery sourced tables within a Composite model. With aggregations, you can create layers of pre-aggregated values, which can be stored in the memory and performed faster.
How Does Aggregation work?
Imagine a Fact table with 250 million rows. Such a fact table is big enough to be considered a good candidate for DirectQuery connection. You don’t want to load such a big table into the memory, and the Power BI file size probably exceeds the 1GB limitation. Now, think about your reporting solution for a second. Do you always query this fact table at the finest or minimum granular level? I mean, do you always look at every single transaction in this table when you do a report on it?
The answer is No. Most of the time, you are querying the data by other fields or columns. For example, you query the Sales value in the fact table by Year. Sometimes, you query the fact table’s values by Customer’s education category. Sometimes, you query the values in the fact table by each product. When you look at real-world scenarios, you are usually querying the fact table by aggregations of dimension tables.

The visual above is querying SalesAmount from the Fact table by the CalendarYear from DimDate;

Aggregated Table
So, if we are querying only by CalendarYear, then we can create an aggregated table. The aggregated table can pre-calculate the Sum of SalesAmount for every CalendarYear. In the case above, We would just have a table with five rows. One row for each year, from 2010 to 2014. The aggregated table is so small (five rows only) that it can be easily imported into the memory, and whenever we query that table, we get a super-fast result.
By now, you may say, I would also query it by Quarter too. You may want to drill down into Month, week or even every single Day. That is fine. Considering 365 days in each year, you will have a table with 5×365 rows; this would be a table including 1827 rows maximum (you may have one or two leap years in the period as well). The aggregated table size is still very tiny (less than 2000 rows) compared to a fact table with 250 million rows. You can still import your aggregated table into the memory. Such a table will cover all the data analysis you want every day.

Layers of Aggregation
You may need to create other aggregations by other dimensions too. Usually, because dimensions are much smaller than the fact table, your aggregated tables would always be smaller than the fact table. These aggregated tables are your layers of aggregation in the model.
The golden rule for a composite model in Power BI is; Do NOT use a lower level table if there is an aggregation on top of it, which can be used for this query.
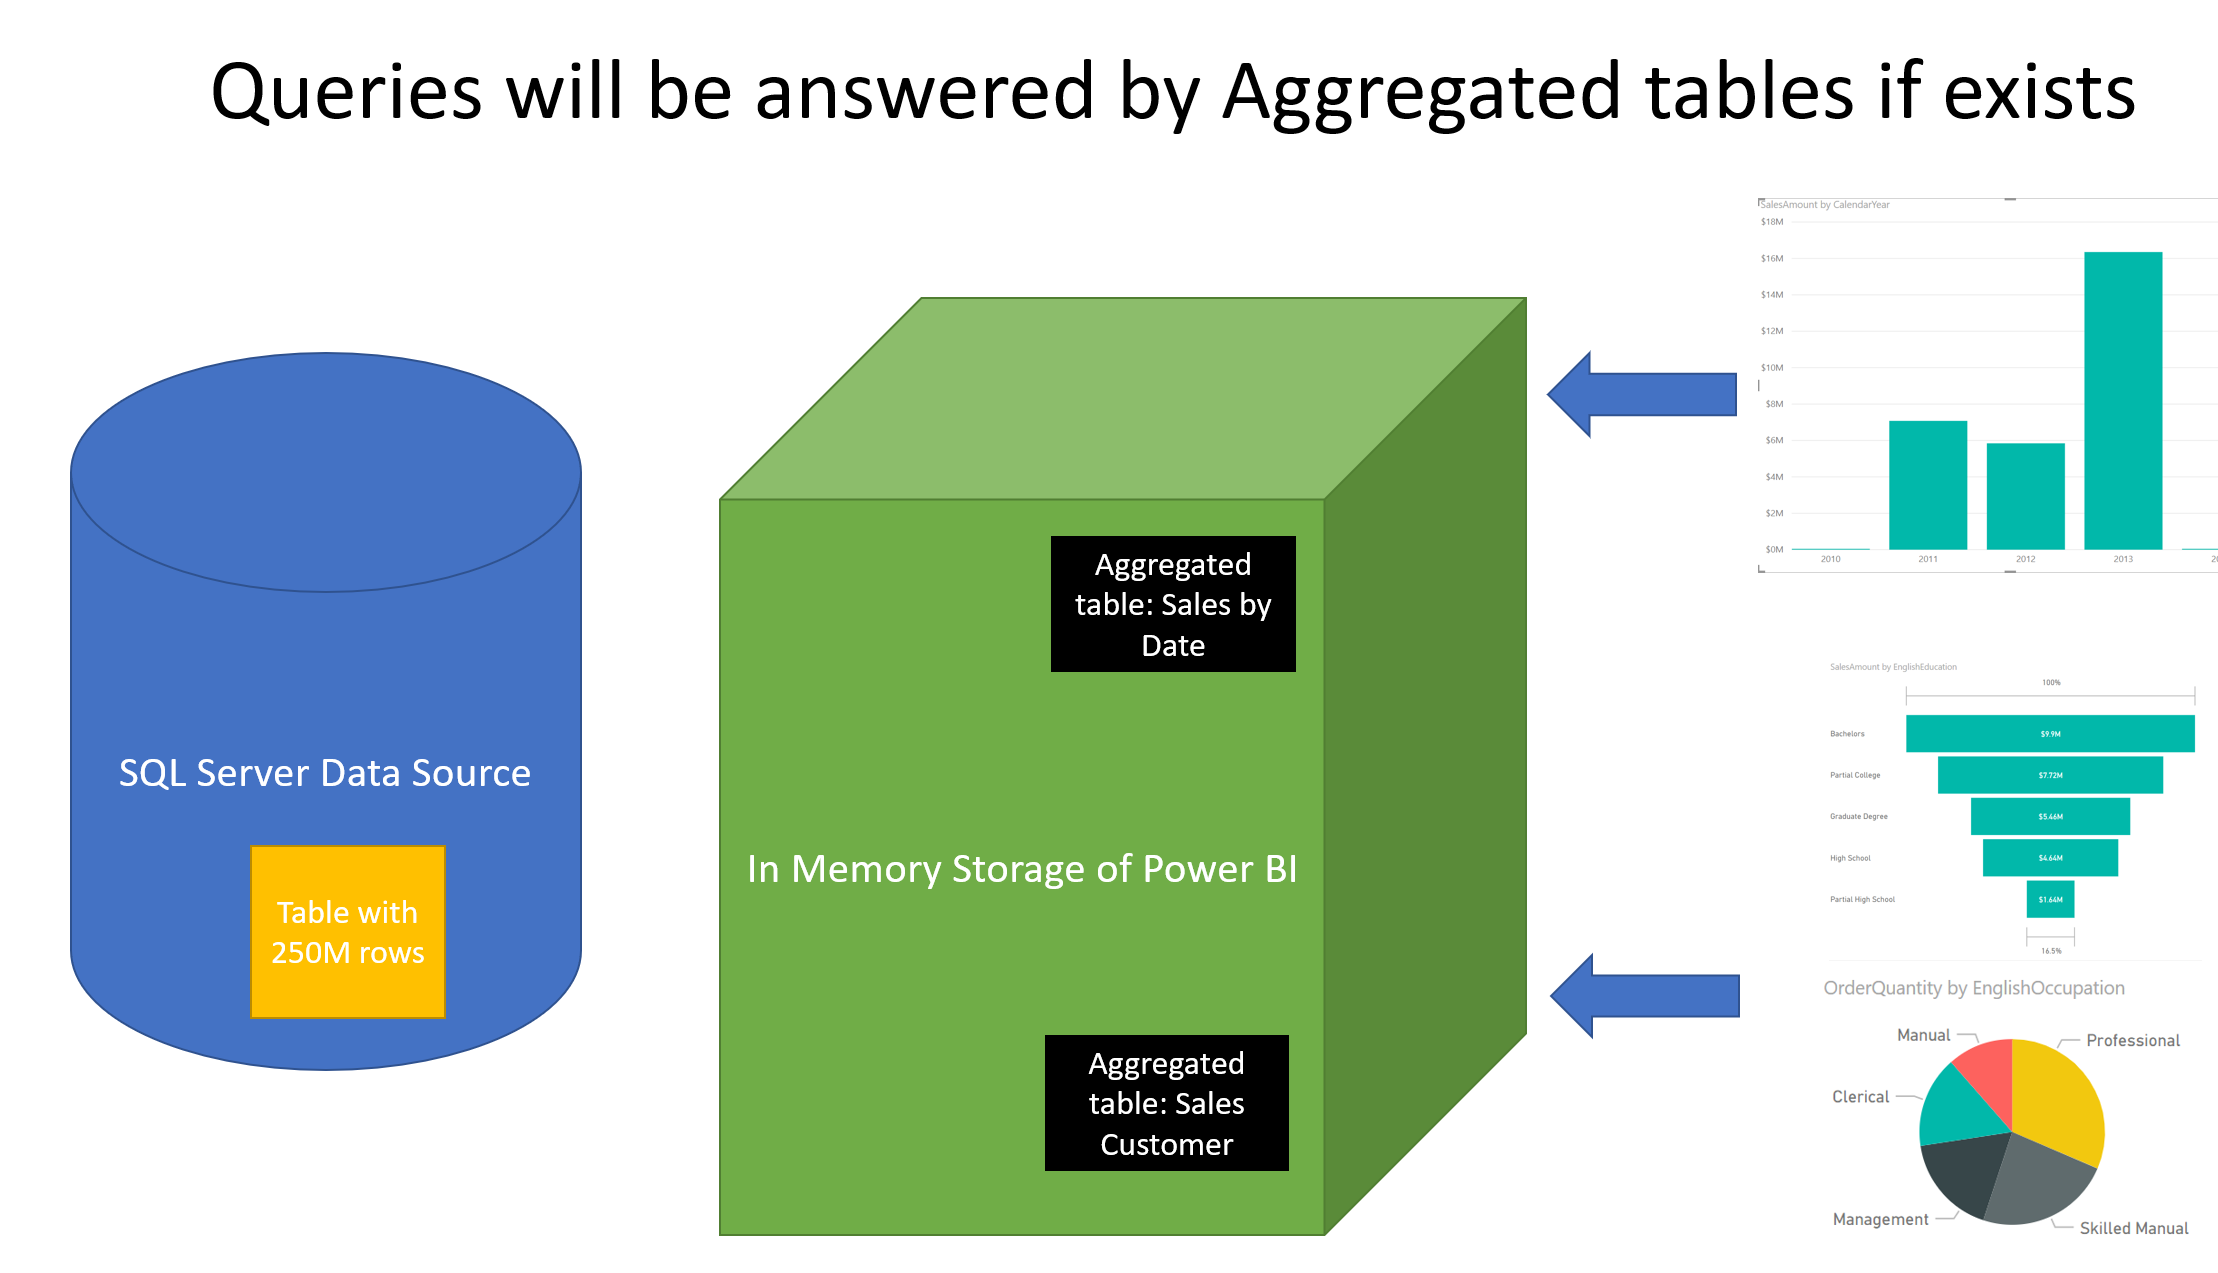
If you are querying even a DirectQuery table with 250 million rows, but you are only querying it by Date, then Power BI act differently. Power BI will not send a query to the data source of the fact table. Instead, it will query the aggregated table in the memory, and you get a fast response. Power BI only will switch to the table underneath if aggregated tables cannot answer the question.
Doing it in Action
The overall process for having an aggregation is;
- Creating the aggregation table

- Creating relationships necessary for the aggregation table and the DirectQuery table

- Setting the Storage mode of aggregated and Dimension tables

- Configuring aggregation

I will write a blog post about each section separately in detail. The next one in this series would be creating the aggregation table.
Creating custom aggregation
The process above is explained in detail below articles;
- Power BI Fast and Furious with Aggregations (the current article)
- Power BI Aggregation: Step 1 Create the Aggregated Table
- Dual Storage Mode; The Most Important Configuration for Aggregations! Step 2 Power BI Aggregations
- Power BI Aggregations Step 3: Configure Aggregation Functions and Test Aggregations in Action
- Multiple Layers of Aggregations in Power BI; Model Responds Even Faster
Aggregation for imported data
Aggregation is not only for DirectQuery tables. Sometimes a very large table that is imported can perform slow. Aggregated tables on imported tables can also improve performance. For situations like that, you need to use DAX measures to switch between the main table or the aggregated table. I have explained that in an article here;
Automatic aggregations
Creating aggregations in Power BI highly depends on using columns and tables in the report. A performance tuning advice would be to start creating aggregations on those columns mostly used in visuals. The good news is that Power BI can automate this process for you. It is called automatic aggregations.
Automatic aggregation is a process in which Power BI will check the usage logs of the columns and tables in the Power BI dataset, and it creates automatic aggregation tables based on that. This requires minimum effort from you as a developer. It all will be handled very simply by Power BI. You can enable this at the dataset settings feature;

There is a setting for how much query coverage you want to get with the automatic aggregations;

Summary
Aggregation is a game-changer feature in the performance and speed of Power BI Solutions when the data source table is huge. With the help of aggregations, you can have layers of pre-calculations stored in memory and ready to respond to queries from the user instantly. The DirectQuery data source will be used only for most atomic transaction queries. Read the rest of the blog series below Aggregations.
Next Steps
- Power BI Fast and Furious with Aggregations (the current article)
- Power BI Aggregation: Step 1 Create the Aggregated Table
- Dual Storage Mode; The Most Important Configuration for Aggregations! Step 2 Power BI Aggregations
- Power BI Aggregations Step 3: Configure Aggregation Functions and Test Aggregations in Action
- Multiple Layers of Aggregations in Power BI; Model Responds Even Faster
- Aggregation on Imported tables


Reza is author of more than 14 books on Microsoft Business Intelligence, most of these books are published under Power BI category. Among these are books such as Power BI DAX Simplified, Pro Power BI Architecture, Power BI from Rookie to Rock Star, Power Query books series, Row-Level Security in Power BI and etc.
He is an International Speaker in Microsoft Ignite, Microsoft Business Applications Summit, Data Insight Summit, PASS Summit, SQL Saturday and SQL user groups. And He is a Microsoft Certified Trainer.
Reza’s passion is to help you find the best data solution, he is Data enthusiast.
His articles on different aspects of technologies, especially on MS BI, can be found on his blog: https://radacad.com/blog.
Hi Reza,
How do you actually create the Aggregation table?
All examples start with Aggregation table already exists
Thanks,
Oded Dror
Hi Oded.
I just wrote a post about how to create aggregated table here
Cheers
Reza
Its Really Grt Thank You So much..
Thanks! A question: if I have a count distinct measure – does this mean I cannot use aggregations?
Hi Michael
Distinct count and any other aggregations you want are supported through the aggregation table. you have to just build the table exactly as you want.
Cheers
Reza
Hi there. One problem I see with this (but might be that I just don’t have enough knowledge about the feature yet) is that while the big fat fact table in the database is being constantly updated and therefore you get the latest data through native queries, it’s not so with the aggregated in-mem tables which, by the way, can get pretty quickly out of sync with the main DirectQuery table. Am I missing anything here? Thanks.
That would only happen if someone goes to every single record in your fact table, get’s the value of that table, and then compare it with the grand total. because grand total comes from the aggregation table, and the row details from the fact table. and that normally isn’t something users would do for a huge fact table.
Cheers
Reza
Hi Reza! I was at your talk today in Copenhagen (I asked the question about many-to-many, which I’m testing now!). I was thinking of another use case, but I’m not sure if it will work. Say perhaps that the users need to access detailed information for recent data, but aggregated for older data (for example order lines for the last 12 months, but only aggregated per month for older orders). Do you think this could be solved with aggregations? Or would we need to use a different approach. In my head I can think of two solutions:
1) that we have a single table, which is both aggregated and detailed. Historical data would be aggregated to a single date per month, with null values for order number etc. Detailed data would of course remain at the most granular level.
2) Separate tables for aggregated and detailed, with the DAX measures determining which table we summarise depending on the date context.
I have come across this scenario before and used solution #1, but I’d be interested to hear your thoughts.
Hi Alistair,
Was great to meet you at Copenhagen 🙂
Regarding many-to-many scenario using aggregation: I confirm that at the moment aggregations won’t work with many-to-many. There is a workaround for it, which I will write about it soon.
Regarding the historical aggregated data and the recent detailed data: method #1 is definitely simpler to implement, as you won’t need bringing more logic in your calculation. However, in terms of performance, I have to check. It is a great idea for another blog post by the way (I might write about it sometime). method #2, however, can be good option to use with the aggregated table. It might not need to hit the details table if aggregated data is needed only (however I have to check it in practice).
Cheers
Reza
Hi,
I have created aggregated tables and my queries are being mapped in the correct way. When I start to build up my DAX formula I found that the FILTER () argument didn’t seem to be supported as when it was used it always ran a Direct Query. Should this be the case? If so could you explain why it doesn’t hit the aggregated table when it should be preferred?
Thanks,
Craig
Hi Craig
There are some limitations to the DAX functions that can work on the aggregated table scenario. For example, Filter in an iterator function. It means it will iterate through each row in the DQ table, and test the filter criteria and then produce the result. Because it has to go through every row, it means the aggregated table won’t be hit. You should use some functions that don’t have this behavior.
Cheers
Reza
Hi Reza,
I know there is a limit of 1 million rows using DirectQuery on Power BI Desktop version but what is the row limit on Power BI Pro, Pro+ and Premium versions which a DirectQuery can fetch using Parameters/Filters?
The 1M row limit exists regardless of the license.
and note that this is the limit of your queries, not the limit of data to work with.
As an example; when you have a column chart with year as the axis and sales as the value, your query only returns one row per year. in total it is probably up to 10 or 20 rows.
So to hit that 1M row limitation, you need to have a visual that has 1M rows in it. Even if that amount of data was possible in one query return, it would not perform fast for sure, regardless of the BI system you use. Filtering visuals to only the required data is always recommended.
Cheers
Reza
Hi,
Do I understand that the aggregate table only shows data from the last update, not the same as direct query? What happened 20 minutes ago can only be specified by a direct query?
Yes, the aggregated table is imported and dependent on the refresh schedule. You can either refresh the aggregated table more frequently, or get the detailed data from the DQ table which is more up-to-date