I have previously written about conditional formatting in Power BI, and how you can take one step further with using DAX to dynamically change the conditional formatting. Conditional formatting with DAX for colors is easy, you can use the color name or their hex code. But for Icons, it is slightly different. You can either use SVG code to get whatever icon you want or use the Icon name for a set of known icons in Power BI. In this article and video, I show you how to use Icon names for dynamic conditional formating using DAX in Power BI.
Video
Credit to: Francisco Mullor Cabrera
The main credit for this blog article goes to Francisco Mullor Cabrera because of his amazing list of Icon names he populated and listed in his article, Which is in Spanish here. I strongly recommend checking it out and connecting with him through his LinkedIn page. So special thanks to Francisco, let’s see how this works.
Prerequisite
I would highly recommend reading the articles below to first understand how conditional formatting in Power BI works and how it works with DAX;
- Show Me the Biggest Number! Conditional Formatting in Power BI
- DAX and Conditional Formatting Better Together: Find The Biggest and Smallest Numbers in the Column
- Enhance the Card Visual in Power BI with Conditional Formatting
- Write Conditional Statement Using SWITCH in DAX and Power BI
- Sentiment Colors for Gauge Visual in Power BI
DAX Conditional Formatting and Colors
If you want to have color conditional formatting using DAX in Power BI, here is an example of such expression:
Gauge Color =
 SWITCH(
     TRUE(),
     [Sales]>7000000,"Green",
     [Sales]>4000000,"Orange",
     "Red"
 )
If the expression above is used in a visual’s conditional format for color, It ends up with colors as below;

To learn more about it, read my article here.
For colors, you can either use the name of the color inside a text, such as “Green”, or you can use their hex code, such as “4fab20”. For Icons, you can use either SVG or Icon names.
Icon Names
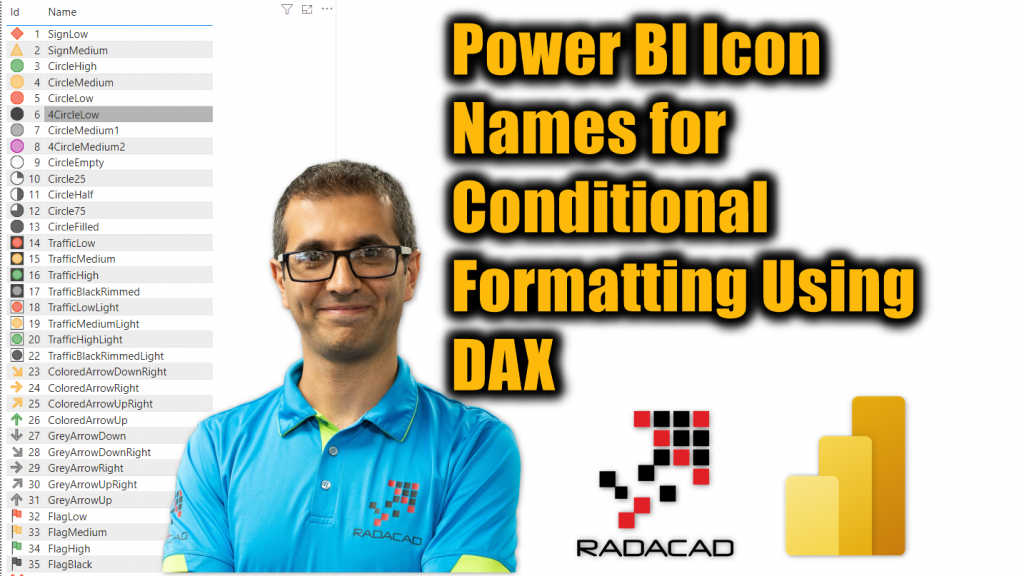
The name of default Icons in Power BI (as kindly mentioned originally by Francisco here) is as below;
SignLow
 SignMedium
 CircleHigh
 CircleMedium
 CircleLow
 4CircleLow
 CircleMedium1
 4CircleMedium2
 CircleEmpty
 Circle25
 CircleHalf
 Circle75
 CircleFilled
 TrafficLow
 TrafficMedium
 TrafficHigh
 TrafficBlackRimmed
 TrafficLowLight
 TrafficMediumLight
 TrafficHighLight
 TrafficBlackRimmedLight
 ColoredArrowDownRight
 ColoredArrowRight
 ColoredArrowUpRight
 ColoredArrowUp
 GreyArrowDown
 GreyArrowDownRight
 GreyArrowRight
 GreyArrowUpRight
 GreyArrowUp
 FlagLow
 FlagMedium
 FlagHigh
 FlagBlack
 SymbolLow
 SymbolMedium
 SymbolHigh
 CircleSymbolLow
 CircleSymbolMedium
 CircleSymbolHigh
 StarLow
 StarMedium
 StarHigh
 StarMediumLight
 StarHighLight
 TriangleLow
 TriangleMedium
 TriangleHigh
 SignalBarEmpty
 SignalBarLow
 SignalBarMedium
 SignalBarMedium2
 SignalBarFull
 SignalBarLowColored
 SignalBarMediumColored
 SignalBarMedium2Colored
 SignalBarFullColored
 QuadrantEmpty
 Quadrant25
 Quadrant50
 Quadrant75
 QuadrantFull
 Quadrant25Colored
 Quadrant50Colored
 Quadrant75Colored
 QuadrantFullColored
And here is the list with the icons beside it

You can download the icon names list as an Excel file from here:
Power BI Icon Names (26462 downloads )Conditional Formatting using DAX and Icon Names
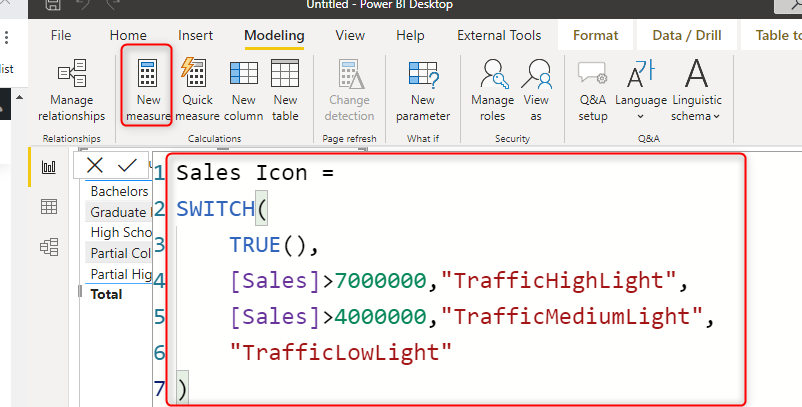
Let’s say you want an icon set based on the [Sales] value. You can create a measure like below;
Sales Icon =
 SWITCH(
     TRUE(),
     [Sales]>7000000,"TrafficHighLight",
     [Sales]>4000000,"TrafficMediumLight",
     "TrafficLowLight"
 )
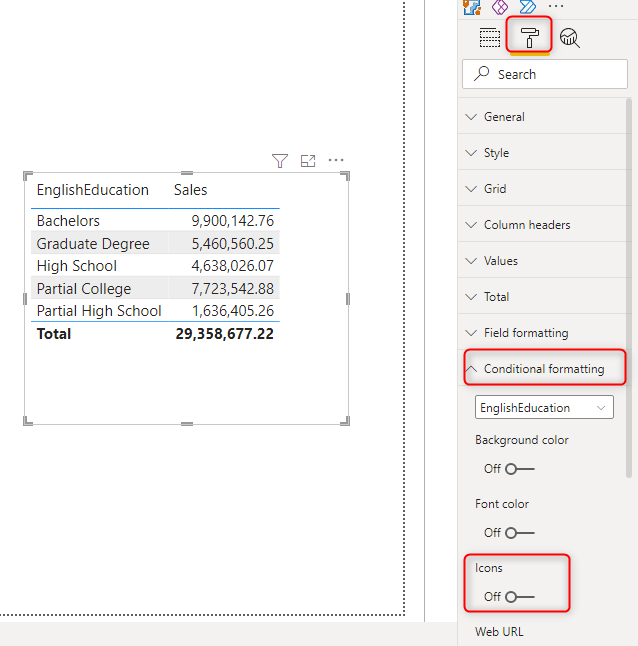
Then in the table or matrix visual, go to the format and conditional formatting, select Icons for the field you want to set conditional formatting upon it. set the Icons as ON.
In the Conditional formatting window, Under Format by, select Field Value.
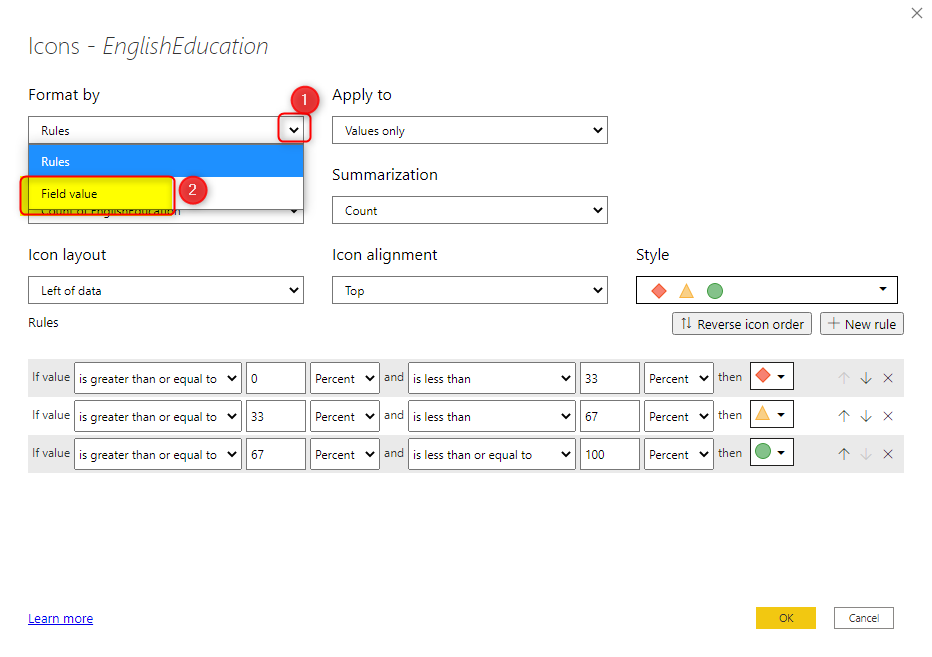
And then under “Based on field”, select the measure for Sales Icon.
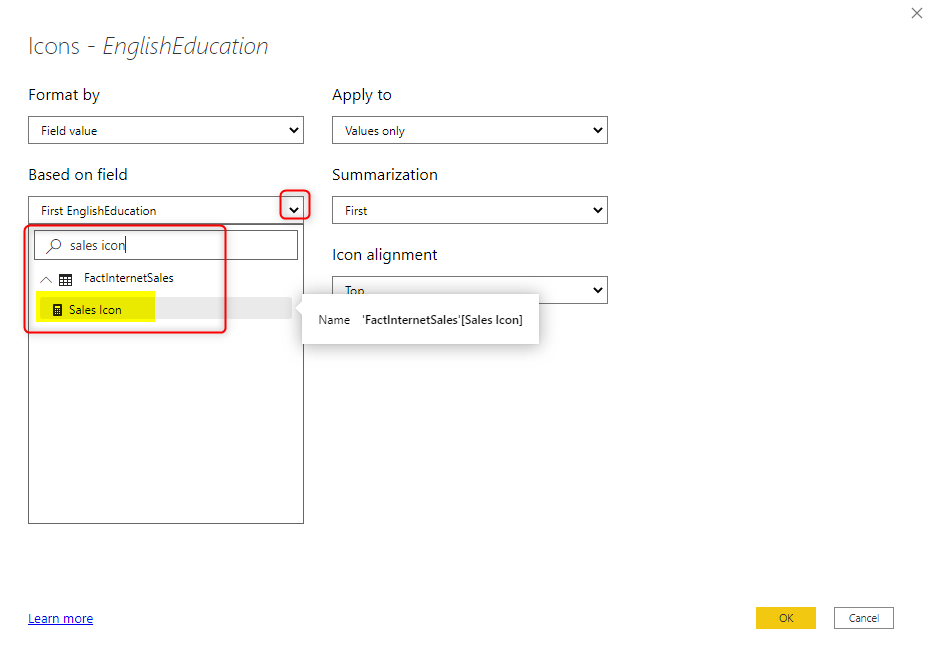
Click on OK, and you will see the icons appearing on the table or matrix visual.
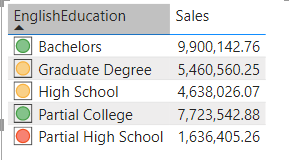
Here you go, you have the icon-based conditional formatting using icon names in the DAX expression. Having the conditional formatting coming from the DAX expression makes it dynamic, you can set the lower or upper threshold using slicers in the Power BI like the example I mentioned here;
Another Method: SVG
Another option to dynamically set icons is to use SVG code, and if you do that, then you are not limited to the default set of icons, you can do anything you want. SVG is a big topic itself, I highly recommend watching the amazing presentation by Laura Graham-Brown about SVG and how to use it in Power BI here.
Summary
Using icons for conditional formatting in Power BI is a great visualization option. This can be enhanced even more by bringing DAX into the equation and writing the conditional formatting there. You can use either icon names as listed in this article (originally referenced from Francisco’s blog) or use SVG (as Laura mentioned in her webinar).


thanks about this information
I am glad it helps!
thanks for icon names
I’ve found very clever the way it was handled the SVGs! Just love it and already put it in use here!