

If you want to print a Power BI report and have a tabular visual in your report (such as a table or matrix), then your options are limited. Fortunately, Power BI Paginated report can help with that. In this article and video, I’ll explain the paginated report and the differences between that and a normal Power BI report, plus situations that you need to use each.
Video
What is a Paginated Report in Power BI?
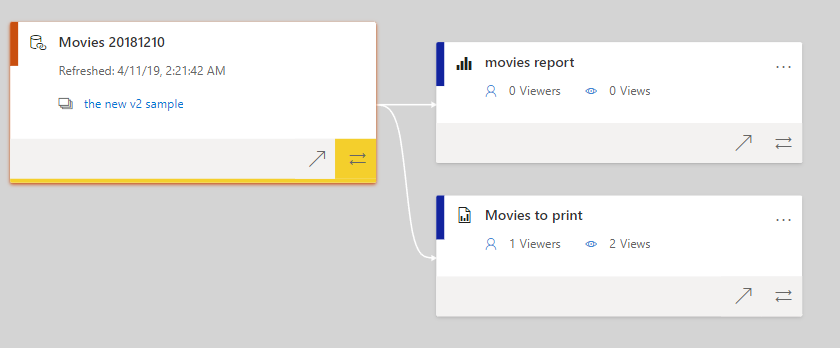
If you look at the screenshot below; you can see that I have two objects in the Power BI service, they both are report type, but they have different icons;
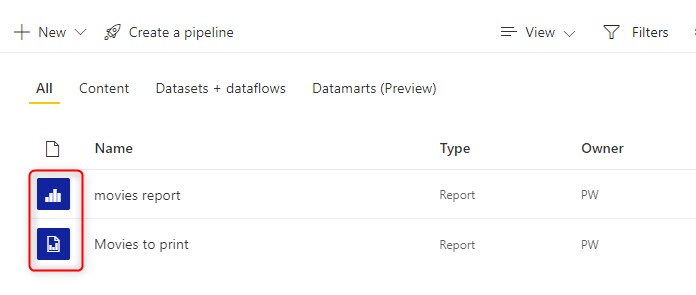
The “Movies to print” report is called a Paginated Report. Paginated Report, although looking like a normal report in the screenshot above, is a different type of report in Power BI.
A paginated report is a report that is created using another tool (Not using Power BI Desktop) and created for a different use case. Paginated reports are designed for pixel-perfect printing. They are ideal for exporting to PDF or printing, especially when the data presented in the report goes over multiple pages (such as a table with thousands of rows). That is why they are called paginated. You can design the report over multiple pages. You can set page headers and footers and categorize them so that certain information goes into certain report pages.
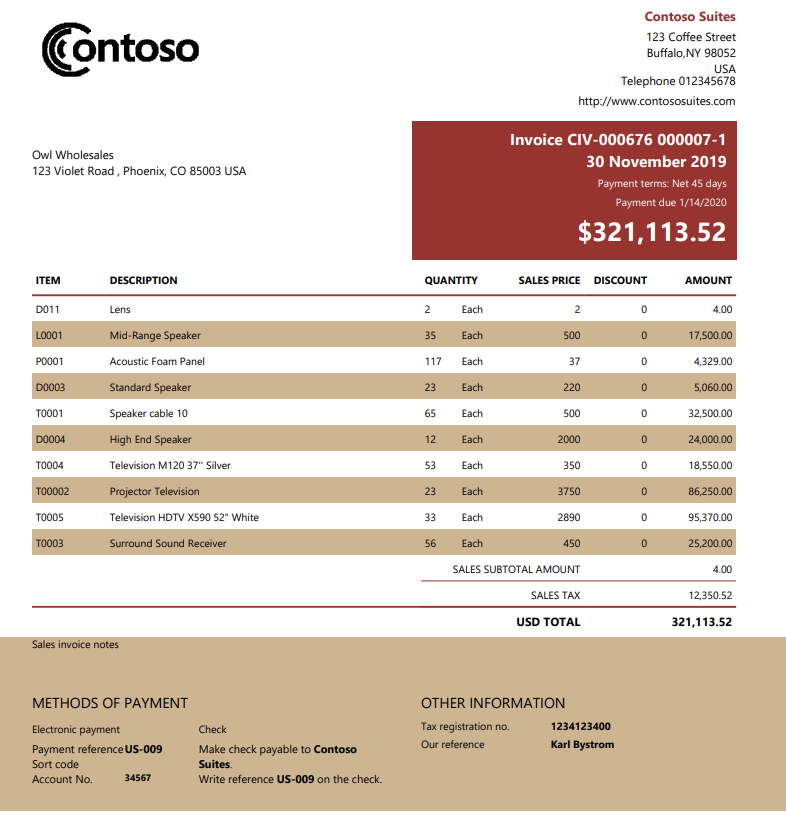
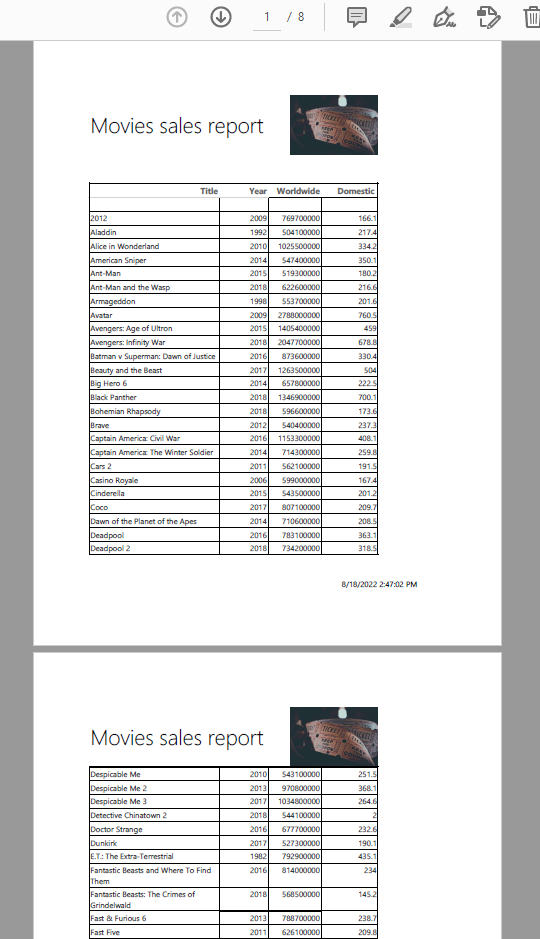
This is a sample of what a Power BI paginated report can look like;
Paginated reports are created using Power BI Report Builder. This is a different editor than the Power BI Desktop and has to be downloaded and installed separately.
Why Paginated Reports?
As you already know, you can use Power BI Desktop to create any report you want. So the question would be; why do we need to create paginated reports? To answer this, you must understand how printing works for a normal Power BI report.
If you have a normal Power BI report (a report that is created using Power BI Desktop), and your report looks like the below;
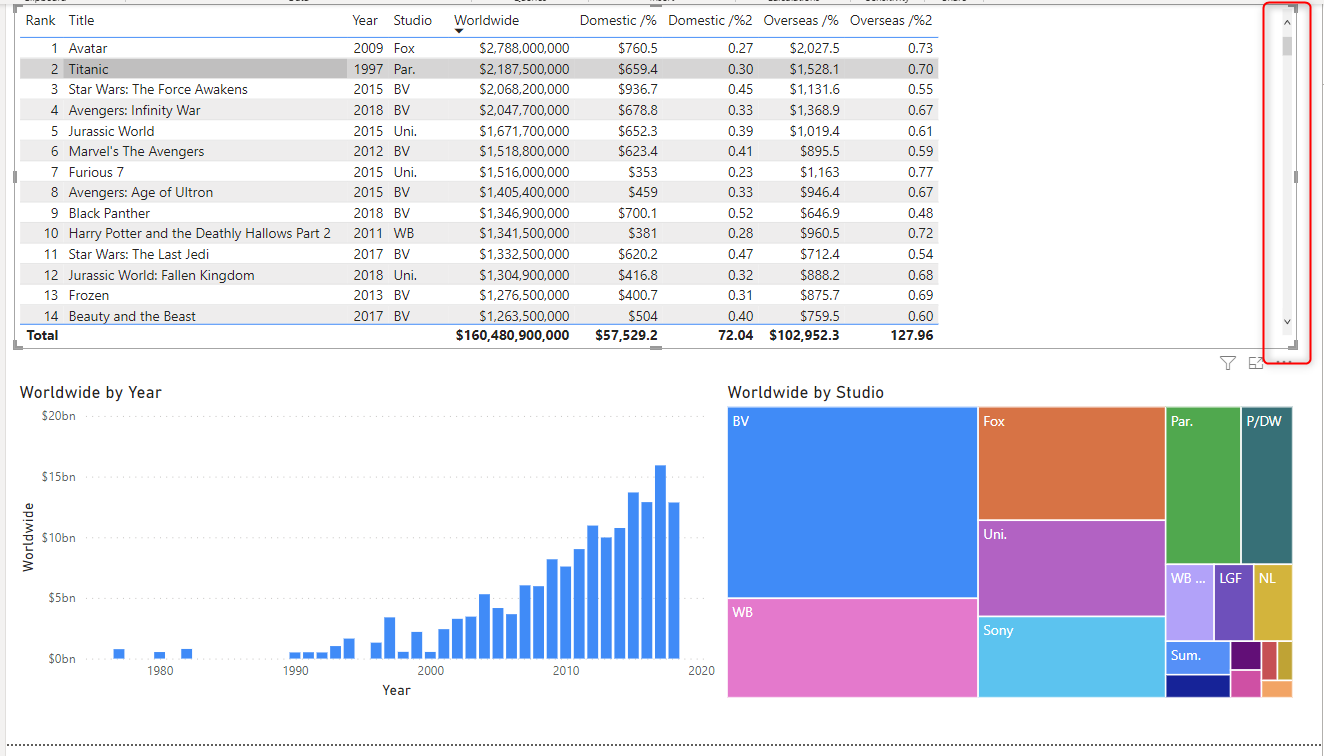
The above screenshot shows a table visual in the Power BI report. Only a few rows in that table can be presented on the screen, so it comes with a scroll bar on the right. In the context of an interactive report, you can easily just scroll down to get to the records you want, or you can filter the report using slicers or other visuals.
However, if you want to print this report, then the printed version of the report will look like the below;
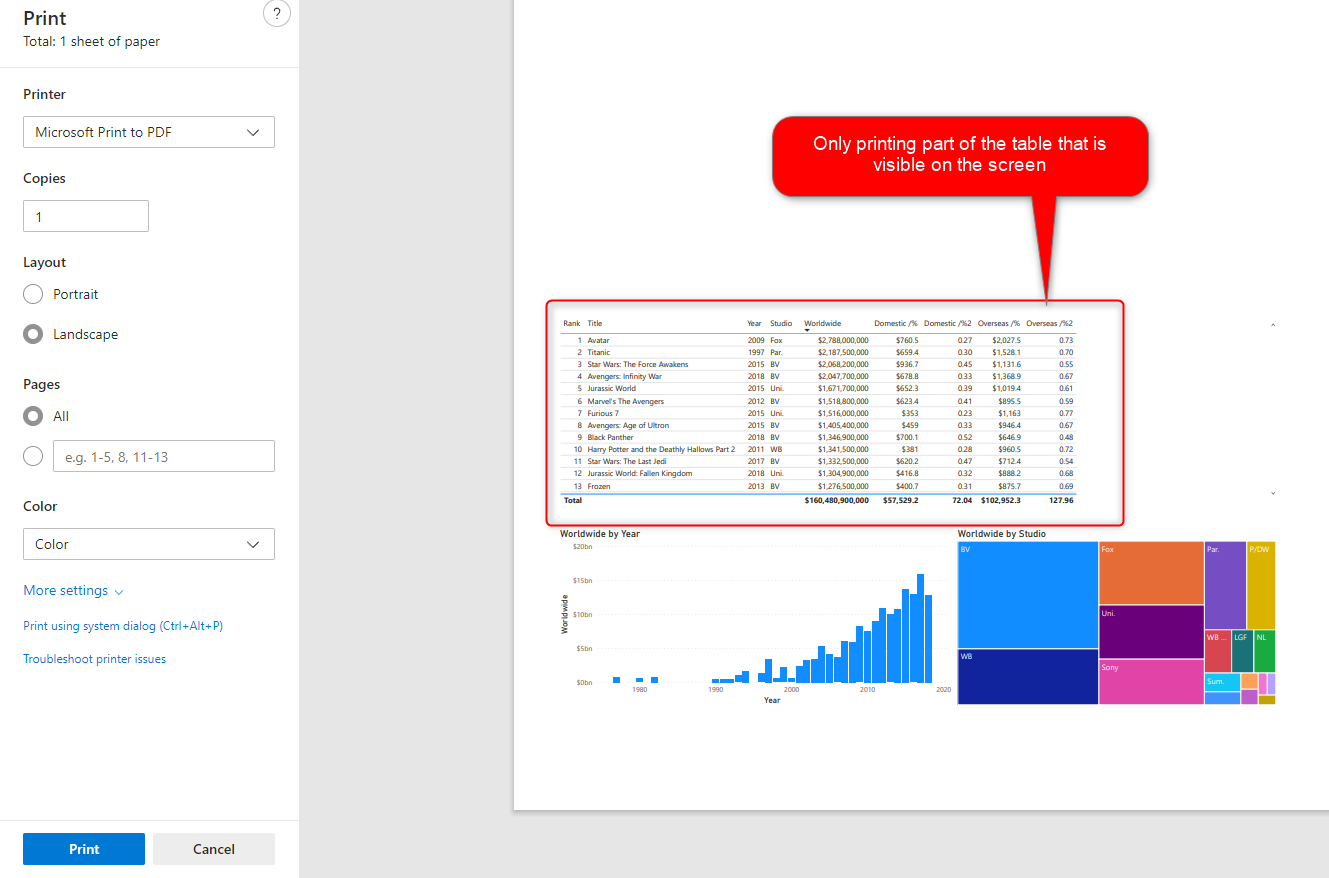
The printed version only shows a few rows visible on the screen. All other rows, which you must scroll down to get to, are not included in the print output. Printing of the content of a table or matrix is not just that simple to say print them all on one page; you need pagination. You may need page headers and footers and some other settings. These are why we have paginated reports in Power BI. A paginated report can be designed exactly as you want to print it in the output.
The difference between Power BI reports and Paginated reports
Although these two are reports hosted in the Power BI service, they are generated for different purposes and have different capabilities. Here is a summary of a few differences;
| Power BI Report | Paginated Report | |
|---|---|---|
| It can be created using | Power BI Desktop Power BI Service | Power BI Report Builder Visual Studio |
| License needed | Power BI Free, Pro, Premium, PPU | Premium, PPU |
| Ideal for | Interactive analytical reports | Pixel-perfect print-ready reports |
| Design Process | Powerful and user-friendly GUI of Power BI Desktop | Powerful but not much user-friendly (more developer-focused) UI of Report Builder or Visual Studio |
| File extension | .PBIX | .RDL |
Do you need a paginated report?
If you ask, “Do I need a paginated report?” I would ask: “Do you need printed reports?”
usually, the answer to my question is, “Yes, absolutely, we need printed reports.” However, my experience shows that people need “accessible reports” rather than “printed reports.”
One of the main reasons that users print reports is to carry them to the meetings, discuss them, and show them to others. Using Power BI mobile applications, especially if you design mobile-friendly reports, you can certainly have normal Power BI reports that can be carried to the meetings (by phone), be discussed (with annotation on them), and shown to others. My experience shows that mobile-friendly Power BI reports can replace many (but not all) paginated reports.

If still, after all of that (designing and adopting mobile-friendly Power BI reports), you feel the requirement of the printed reports, then I would say that is the time you need to go and create paginated reports.
Architecture Best Practice: One Dataset to rule them all
If you create paginated reports, I urge you to consider the best architecture practices. The best architecture for development is the one that requires less maintenance and re-use components as much as possible. I explained how a dataset could be shared for multiple Power BI objects in the multi-layered architecture article and the shared dataset article.
Paginated reports can get data from a Power BI dataset. I strongly advise you to do that because your normal Power BI and paginated reports are sourced from the same dataset. Any changes in that dataset will then be available to both reports.
If you do this design, you can build a powerful reporting system. The Power BI report can be the interactive landing page report for the user. If they want more paginated details, you can build a master-detail scenario of passing some details using parameters to the paginated report and navigating between these two. This is a great way of combining the power of both types of reports into one analytical system.
Power BI Report Builder
Your tool to create a paginated report is called Power BI Report Builder. This tool (before the age of Power BI) was called Reporting Services Report Builder, or SSRS report builder. This is a lightweight tool for creating print-ready reports. However, compared to the Power BI Desktop, the Report Builder is not a user-friendly tool.
You can download and install the Power BI Report Builder from here: https://aka.ms/pbireportbuilder
This tool has a wizard to start building a report. Usually, this is a good starting point if you are a beginner in using this tool.
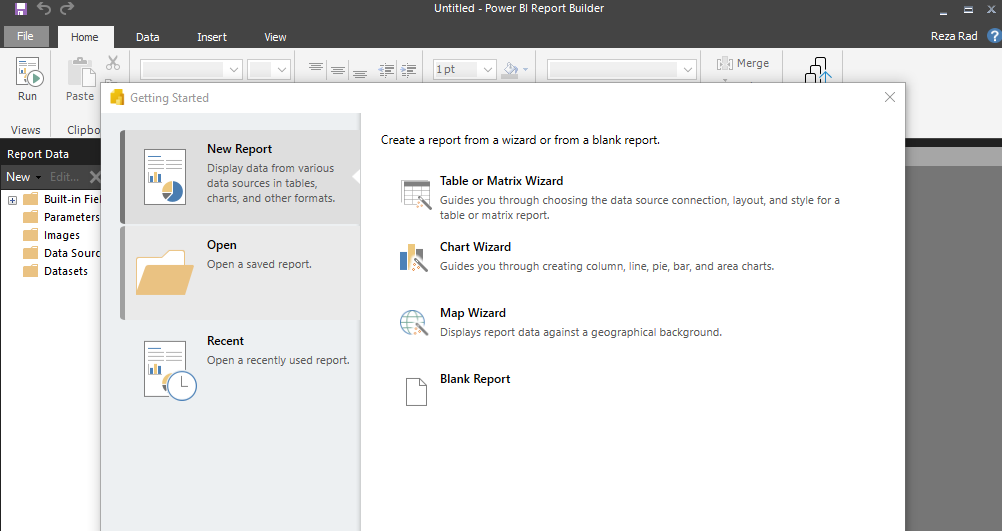
The designer (or Report Builder) has settings and configurations to set for creating a print-ready report.
This differs from the Power BI environment, where things are more drag-and-drop, interaction-friendly. Remember that Report Builder is created at the age of SQL Server Reporting Services, and the UI is older.
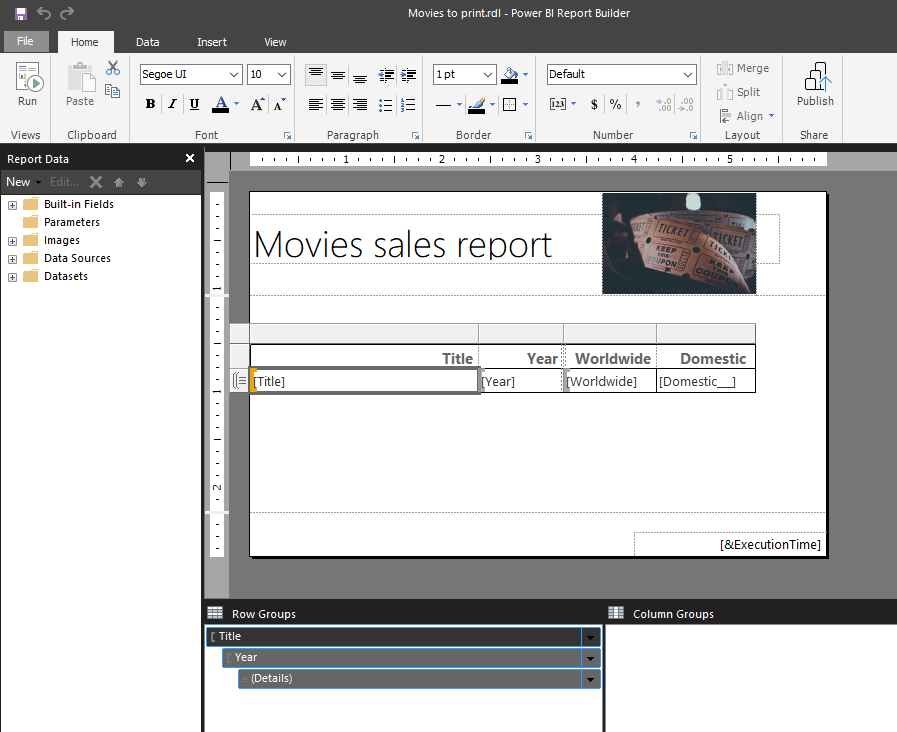
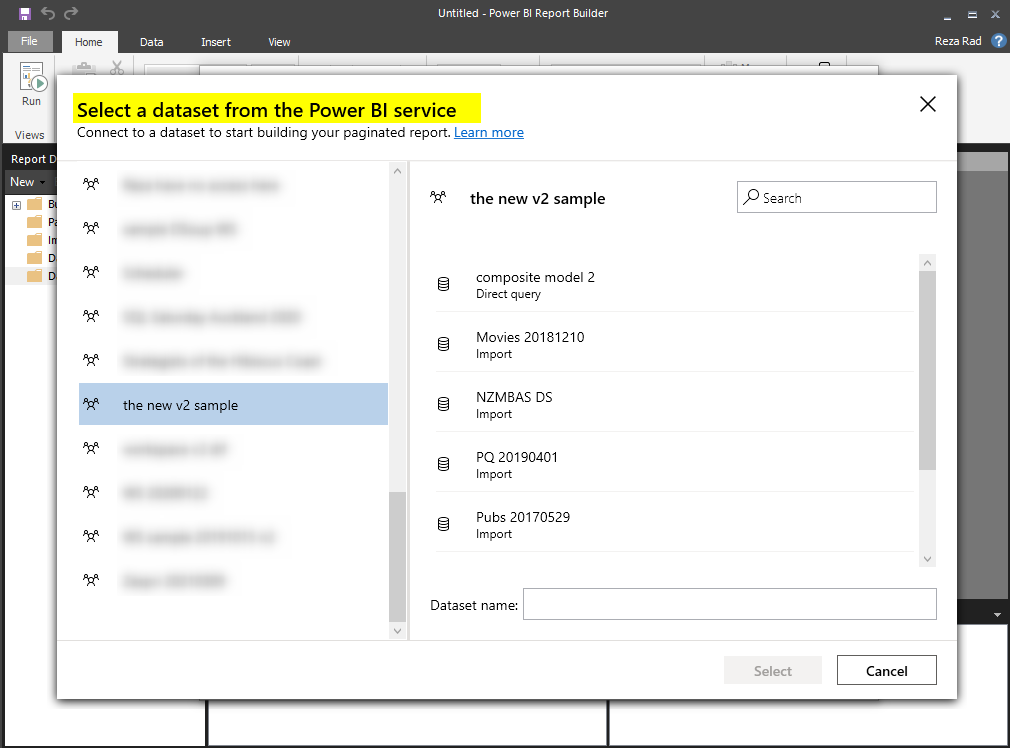
In the Report Builder, you can get data from a Power BI Dataset, which is what I would recommend you to do;
After building your report, you can then publish it to the service;
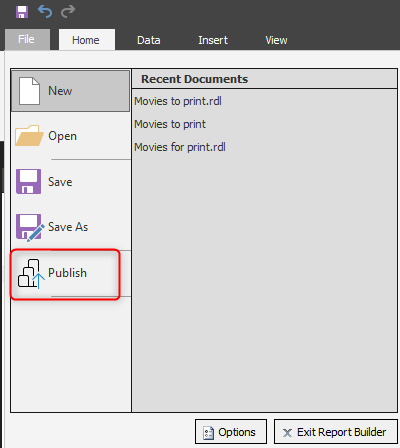
The publish is only possible in Premium or PPU workspaces. The screenshot below is a view of a paginated report.

The learning curve for the Paginated Reports is longer and steeper than the Power BI Desktop. Some of the changes you can do only in Visual Studio. Many of the configurations are not designed as user-friendly as the Power BI Desktop. However, Paginated Reports are SSRS reports in nature, and SSRS is a very powerful visualization engine. There are books with over a thousand pages covering that technology.
Summary
Paginated reports are pixel-perfect print-friendly reports. These reports are designed using Power BI Report Builder (And can also be extended using Visual Studio). They are not usually as interactive as the normal Power BI reports, but they serve perfectly for printing. Before creating these reports, always first think twice; “do you need print-ready reports?” Or maybe accessible reports (such as mobile-friendly reports) serves you better. If you are creating paginated reports, use shared datasets to have a good layered architecture for your Power BI solution.


Reza is author of more than 14 books on Microsoft Business Intelligence, most of these books are published under Power BI category. Among these are books such as Power BI DAX Simplified, Pro Power BI Architecture, Power BI from Rookie to Rock Star, Power Query books series, Row-Level Security in Power BI and etc.
He is an International Speaker in Microsoft Ignite, Microsoft Business Applications Summit, Data Insight Summit, PASS Summit, SQL Saturday and SQL user groups. And He is a Microsoft Certified Trainer.
Reza’s passion is to help you find the best data solution, he is Data enthusiast.
His articles on different aspects of technologies, especially on MS BI, can be found on his blog: https://radacad.com/blog.
Could you please recommed some books, training material you mention in the video?
Yes, I recommend this course of ours for Power BI Paginated reports
Cheers
Reza