
This is not story of Power BI in Power Point slides. This post is about how to use Power Point integration with Power BI for story telling of Power BI reports and dashboards through slides, and also give some users features such as commentary. This features is not a new feature, it has been released almost a year ago! but because many people still are not aware of such feature, I intended to write about it in a post. In this post you will learn;
- Enabling Power BI Power Point Integration
- Pin Live reports and dashboards elements in Power Point Slides
- Using Power Point and Power BI from storytelling with commentary feature
If you want to learn Power BI, read Power BI online book; from Rookie to Rock Star.
Prerequisite
Dashboard and reports used in this example are sourced from Power BI Desktop; The First Experience.
Power BI Tiles
Power BI Tiles is an add-in for Excel, Power Point and few other Microsoft Office products version 2013 SP 1 or later. This component is developed by DevScope. Please note that this is not Microsoft built-in feature. However it can be used easily with Microsoft Power BI and Power Point. This component enables Power BI reports and dashboard elements to be pinned in Power Point slides. Download this component and install it from there, or from your office project.
Installation
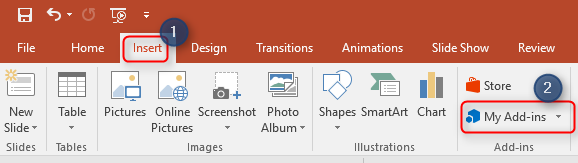
Open Power Point, create a blank slide deck, then insert a BLANK slide, and from Insert menu option, click on My Add-ins
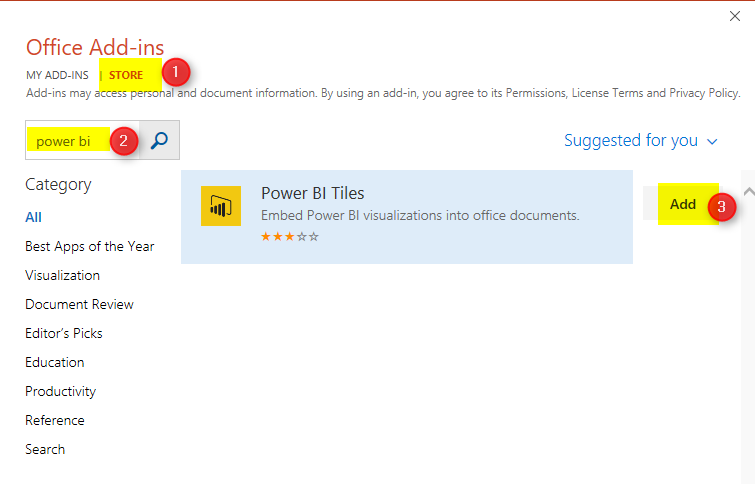
From My Add-ins you might see Power BI Tiles if you have installed that before. otherwise go to Store tab, and search for Power BI
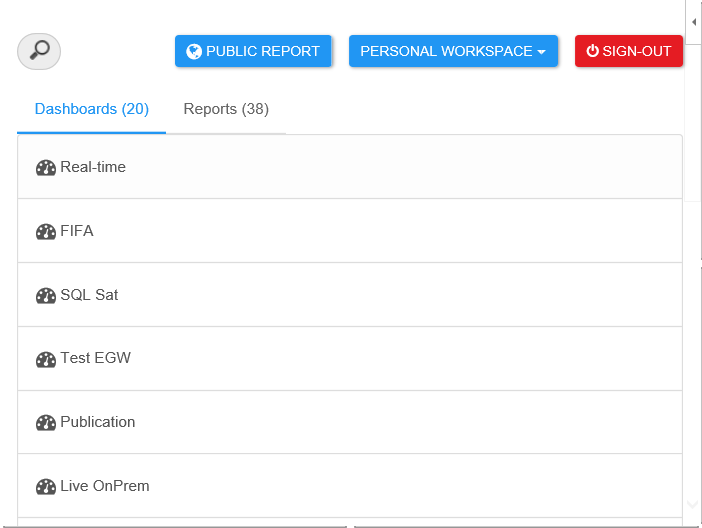
After adding this add-in you will be ask to enter Power BI account related to this, and also authorizing Power BI tiles to access reports and dashboards in your Power BI cloud storage. After authorization you will see a box including list of dashboards in your work space will appear.
Adding Power BI Tiles to Slides
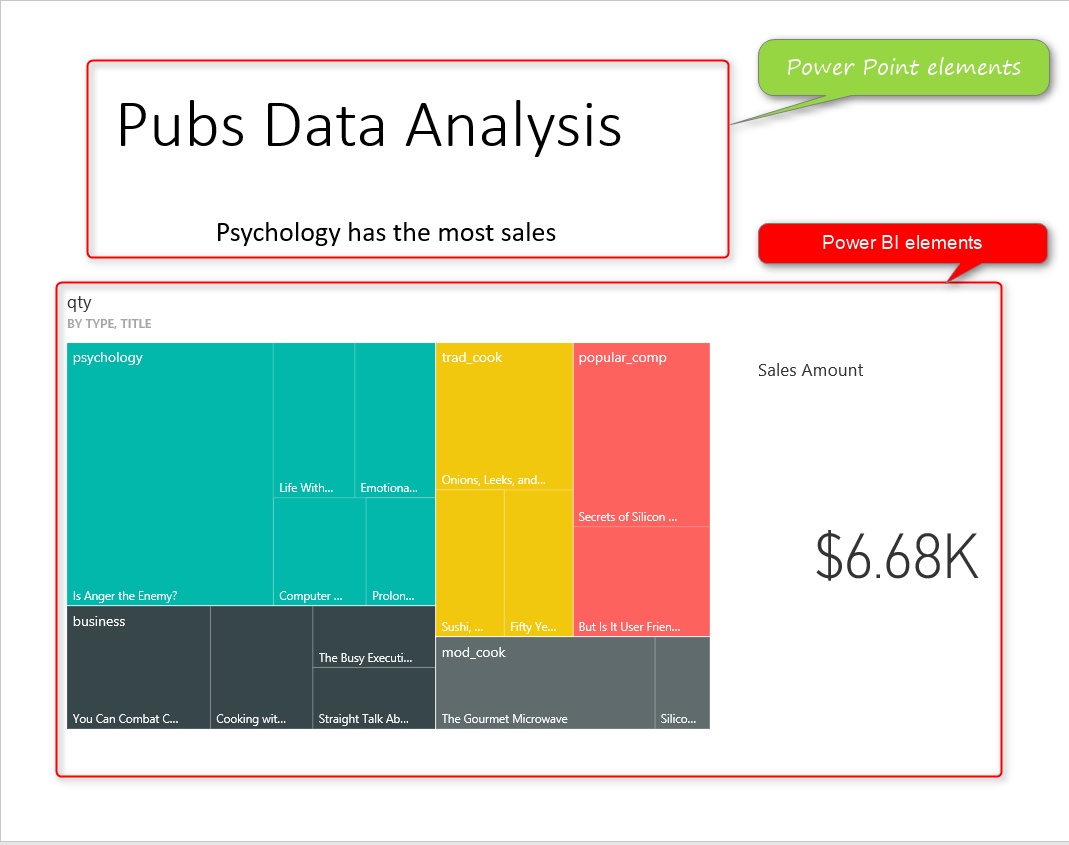
This box is Power BI Tile added to your slide. You can select any of dashboards you want. for this example I use the dashboard which is related to Pubs Data Analysis Demo I’ve done before. After choosing a dashboard you will see one of its tiles appear here.
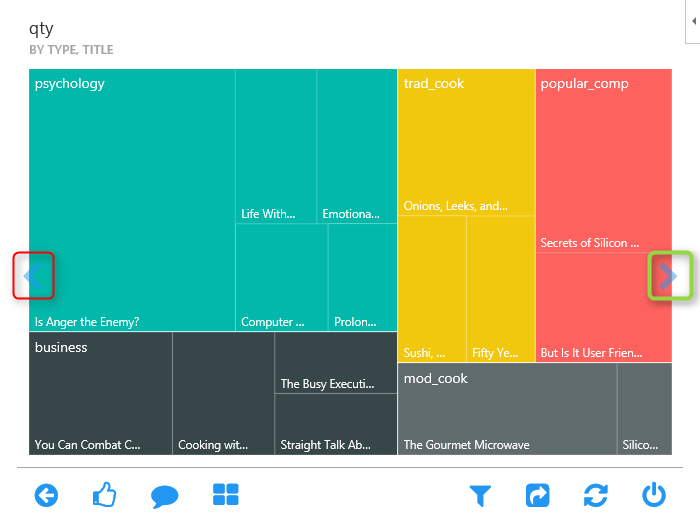
This is only one of the tiles in the existing dashboard, You can navigate between tiles by two navigator arrow buttons highlighted above.

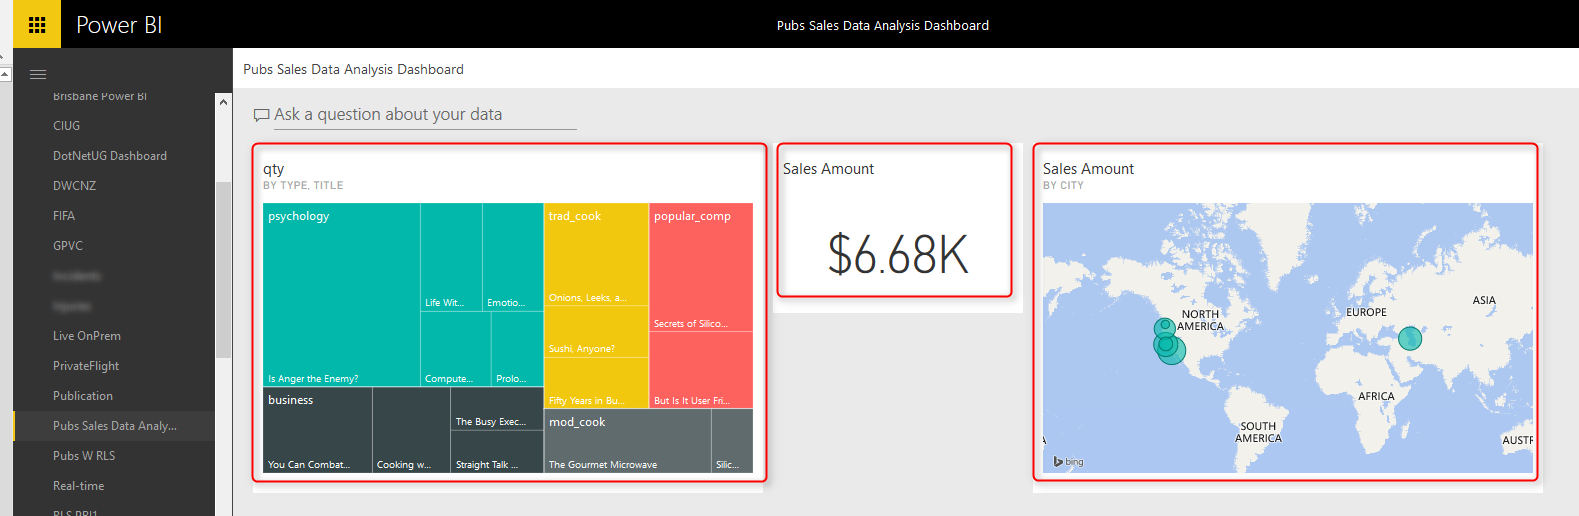
Here is the dashboard in full view in Power BI service. as you can see in Power BI Tiles add-in we can navigate between tiles individually.
Once you chose the tile, you can leave it there. It is already embedded into your Power BI slide. You can now add another Power BI Tile, again from My Add-ins and this time Power BI Tiles is there. Note that you can build similar dashboard here in Power Point with adding each item as a tile.
Storytelling with Power BI and Power Point
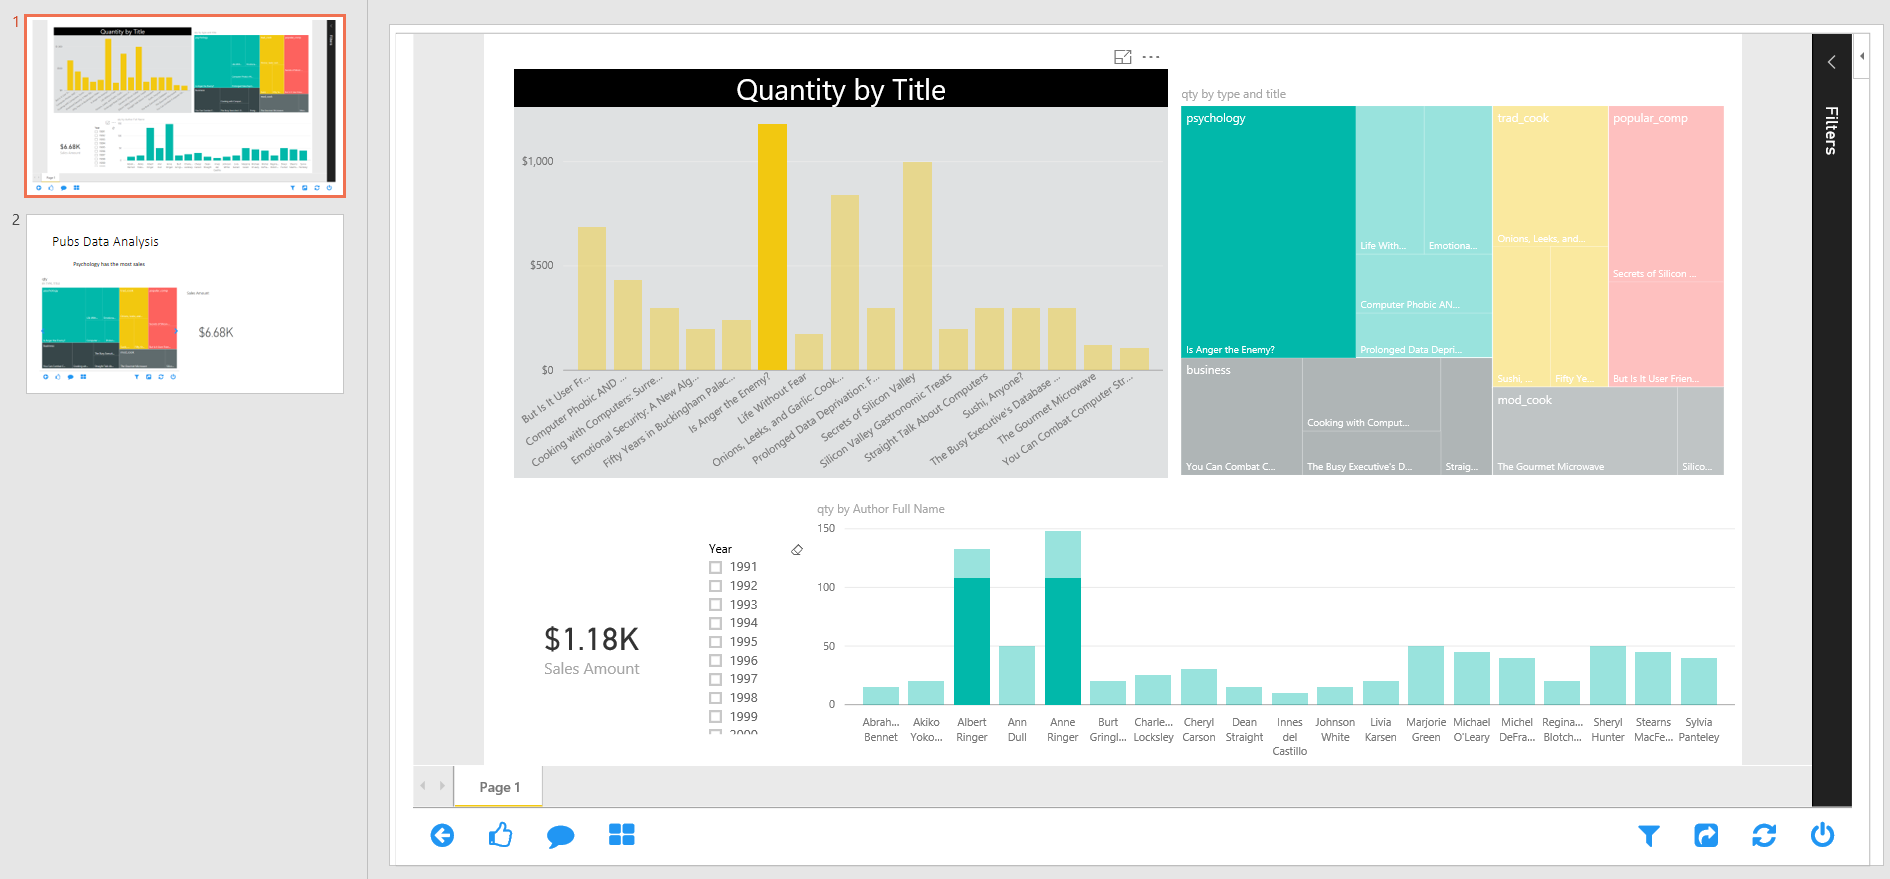
You can see here that I’ve added a title for this slide in Power Point, and also a Textbox with text “Psychology has the most sales”. Yes, with this method you can add commentary to Power BI reports and dashboards, you can tell the story behind the data with integration of Power BI and Power Point. very simple feature but really useful.
Under each Power BI tile in Power Point there will be a link to Power BI
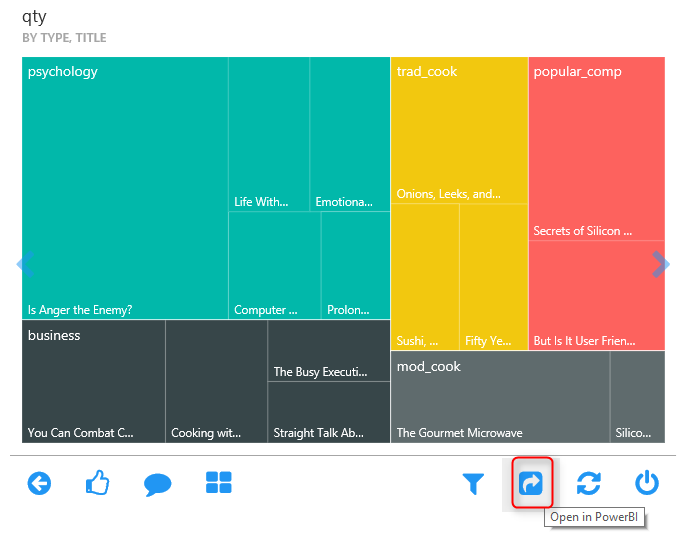
When you click on this link, it will open that Power BI dashboard or report in a browser. This provides you the navigation from a high level story point to the detailed report in Power BI service.
Images or Re-Loaded Tile Feature
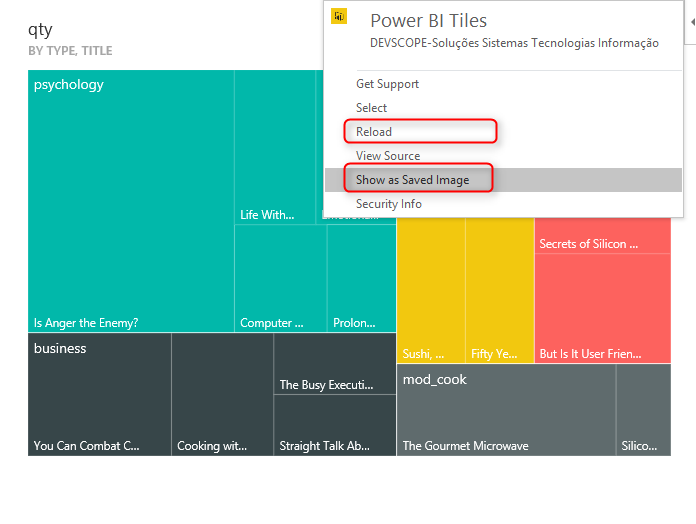
By default Power BI Tiles are interactive tiles that can be refreshed and clicked, highlighted, and interactive. However if you want them as an image only tile, you can choose it from top right hand side of Power BI tile.
Working with other Work Spaces
You can navigate to all other work spaces that you are part of, and see all reports and dashboards under it. by default Power BI Tiles will look into “My Workspace” (named as Personal Workspace), but you can change it from the top side of Power BI Tile.
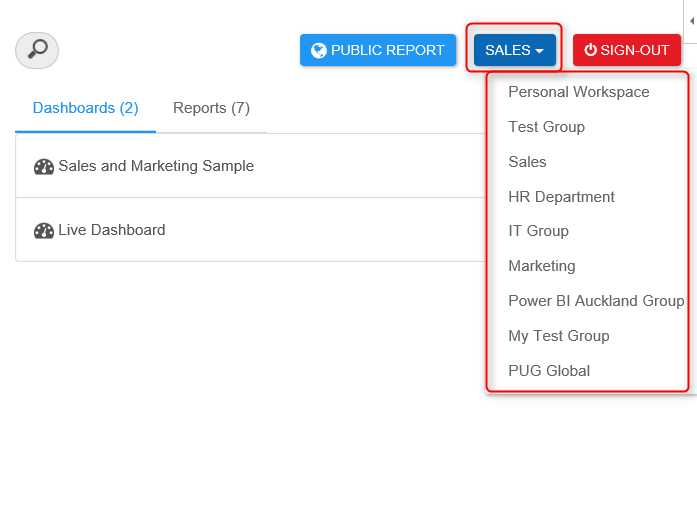
You can also bring a Power BI public report ( a report that is published to web) into a tile

Reports in Tile
If you choose dashboard, then you can pick one element of dashboard in each tile. but if you choose a report. For example “Pubs Analysis” report we’ve built in another example, then you will see the whole report in tile, with all report pages, and filter pane.
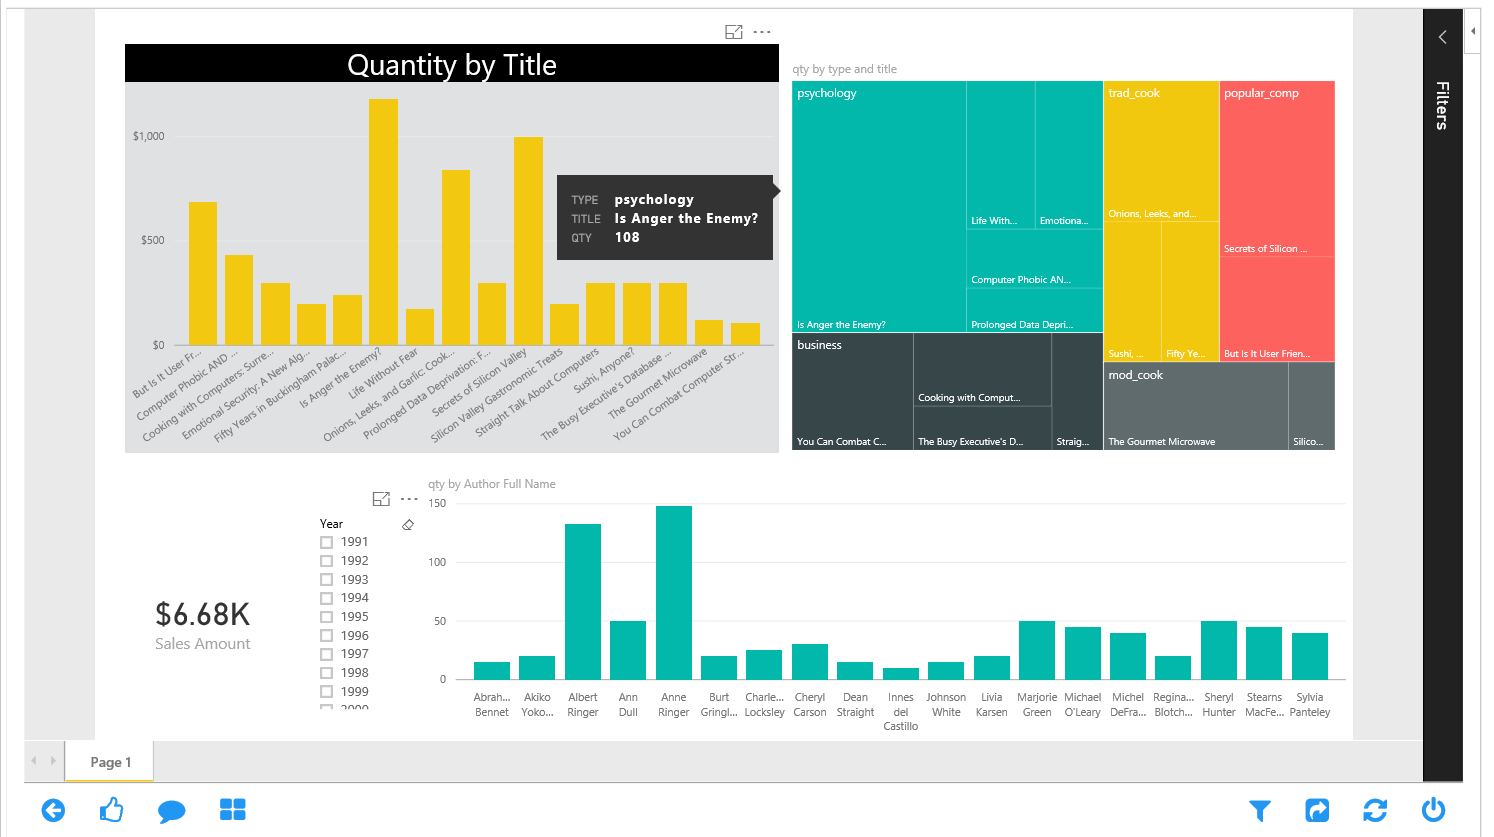
The view of report is fully interactive here. For example if you hover on something or click on something you will see it responds like any other Power BI reports (but in Power Point slide)
Summary
Power BI and Power Point integration helps to tell story behind the data much easier. You have presentation and story telling features of Power Point, plus interactive visual, refresh-able from cloud features of Power BI. Good news is that Microsoft team is working on another integration feature named “Export to Power Point” which will be released very soon I believe. I’ll put together another post when that feature comes live.


Reza is author of more than 14 books on Microsoft Business Intelligence, most of these books are published under Power BI category. Among these are books such as Power BI DAX Simplified, Pro Power BI Architecture, Power BI from Rookie to Rock Star, Power Query books series, Row-Level Security in Power BI and etc.
He is an International Speaker in Microsoft Ignite, Microsoft Business Applications Summit, Data Insight Summit, PASS Summit, SQL Saturday and SQL user groups. And He is a Microsoft Certified Trainer.
Reza’s passion is to help you find the best data solution, he is Data enthusiast.
His articles on different aspects of technologies, especially on MS BI, can be found on his blog: https://radacad.com/blog.
Hi Reza,
As you have mentioned under “Reports in Tile” is it possible to created PowerPoint Slides on the fly in Power Bi Tiles add-in. Suppose i have 4 tiles under a report, so is it possible to create 4 Slides under powerpoint and render the tiles slides wise
i.e. Slide 1 -> contain Tile 1
Slide 2 -> contains Tile 2
Slide 3 -> contains Tile 3 etc.
and it should render there tiles per slide without manual intervention.
I may not be the best person to answer this question. This is more Power Point question. Someone with good experience and knowledge in Office should know that. Maybe with VBA it be possible.
Hello
Is PowerBITiles a trusted Addin by Microsoft? I could not find this information in the AppStore..
If yes should be supported with the non online version pf Powerpoint?
Thanks
Asma
Hi Asma
This add-in is a third party component, not from Microsoft.
Cheers
Reza