
I have previously explained how to analyze the data of a status log table and a from/to date table (like a subscription pattern). I also explained that in some scenarios a from/to table works better than a status log table. In this article and video, I’ll explain how you can transform or convert a status log table into a from/to or start/end table using Power Query in Power BI.
Video
Input table
The data of a status log table comes with some columns for the item, the status, and an effective date. Here is an example of an input data table;

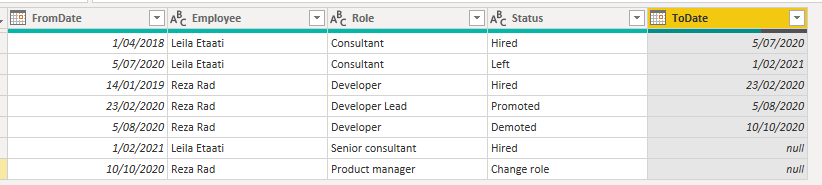
Desired table
The desired table, however, is a from/to (or start/end) table, as it can be analyzed in a more efficient way as I explained here.

As you can see in the structure above, we can see each employee and their role with the effective FromDate and ToDate. Let’s see how the input table can be transformed into the desired shape.
Power Query for Data transformation
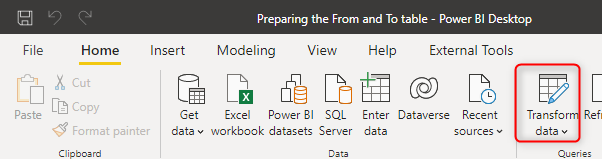
You can do the transformation above using any data transformation tools or language. I am showing it using Power Query. To use Power Query, go to Transform Data in Power BI Desktop. This will open the Power Query Editor window.
Merge with Next row of the item
The data of the input table is using an Effective Date column. What we need to do is to first sort the records for each item (employee, customer, or anything that the table is based on it). and then merge each record with the next record for the same item. This can be done with the steps below.
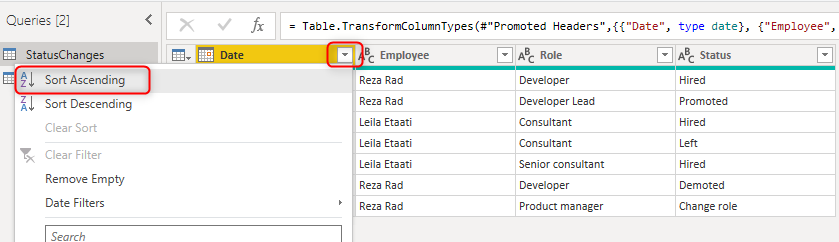
Sort the date column
As the first step, sort the Date column ascending. This will bring the oldest record to the top.
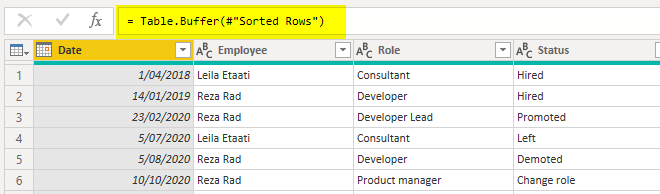
Use Table.Buffer as an extra step to ensure that the sorting is definitely happening before the next operation which is the group by. for this purpose,
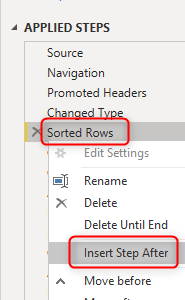
for the new step, write the formula below in the formula bar. You can enable the formula bar using the method I explained here.
= Table.Buffer(#"Sorted Rows")
The #”Sorted Rows” is the name of the previous step, which, if has a space in it, has to be used inside #””. Read more about this formatting of M expression here.
Group by item: Employee, Customer, etc.
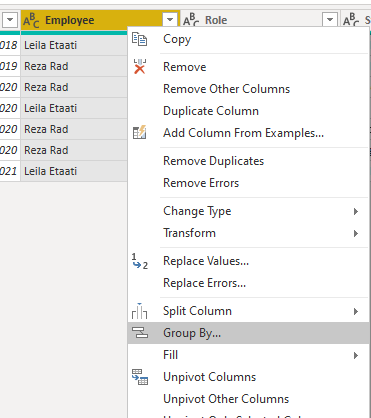
The data now can be grouped by the key item. In my sample dataset, which is for employment status changes. the Item is the employee. If I group data by each employee, then I have the status changes of each employee in a sub-table. To perform group by, you can right-click on the Employee column (or whatever the key item column is in your dataset);
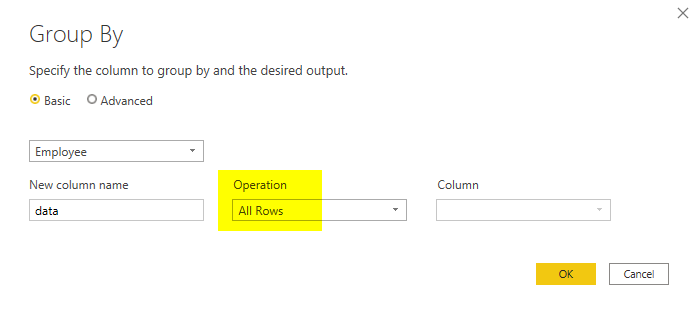
I have written about the Group by transformation previously in detail, which you can read more about it here. In the Group by transformation window, select All Rows as the operation. This option will give you the sub-table in another column.
The output table now should look like this:
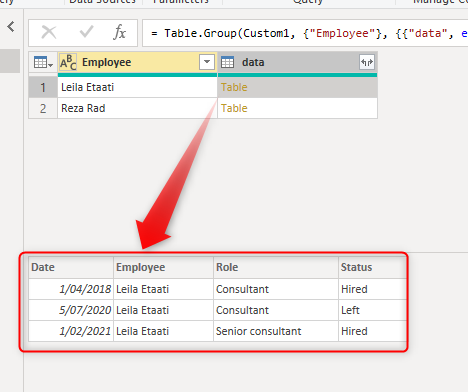
The sub-table includes all the status changes of each employee.
Add Index Column
To merge each record with the next record, we can use an Index column. The Index column has to be added to the sub-table however. Adding it to the main table will not reset the index for each employee. I have explained a technique to add an index to the sub-table in this article.
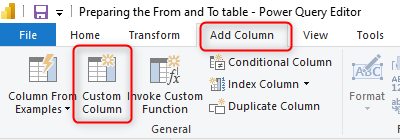
Add a custom column from the Add Column tab;
The code for the new custom column can be like this;
Table.AddIndexColumn([data],"Index",1)
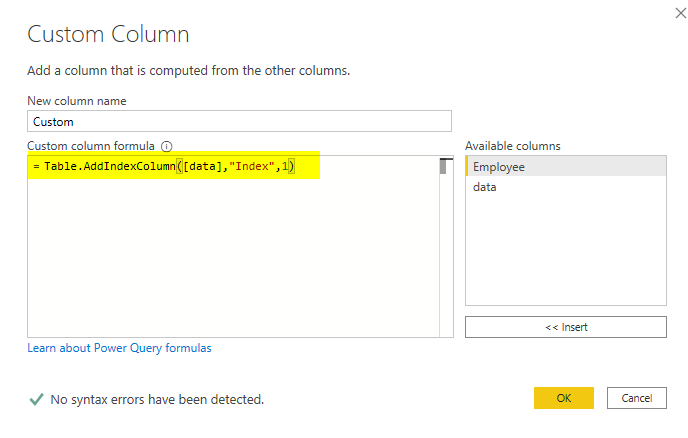
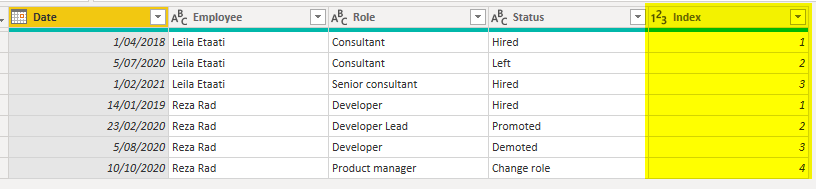
The [data] is the name of the column that includes sub-tables. The Index is the name of the new column that will have row numbers in it, and the 1 is the starting index of row numbers. Here is the outcome so far;
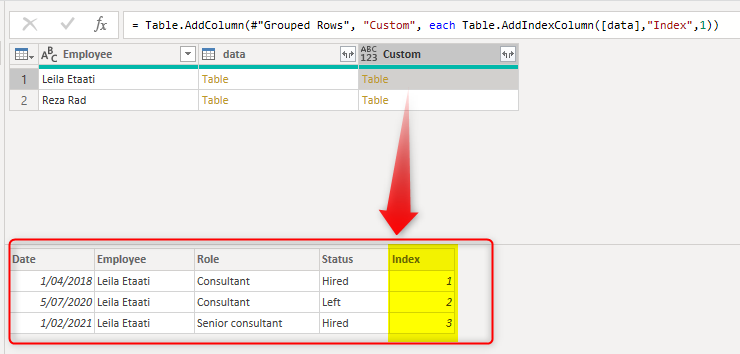
As you can see, the sub-table now has the index column added.
Expand
The next step is to expand the table with the index column. But before that, let’s remove extra columns;
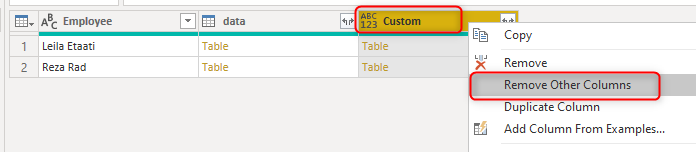
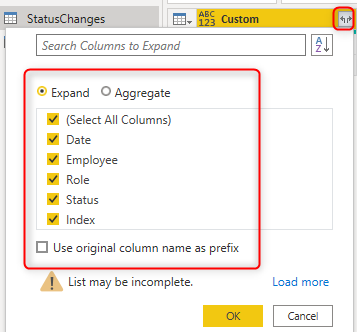
Now you can expand the sub-tables using the expand button on the custom column;
Now you have the same table as the input table but with an Index column added per employee. As I mentioned, the method is also explained here in detail.
Duplicate table
Now merging each record with the record after that is simple. You have to create a copy of this table, then merge it with this table based on Employee and the index to march the index+1.
To create a copy of this table, right-click on the table and create a duplicate. I explained what is duplicate in this article.
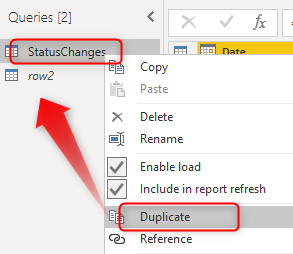
I named the new duplicated copy table as row2. and I disabled the load of this table;
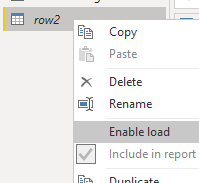
This is because this table will be used only internally inside Power Query and will be merged back to the main table but not loading itself into Power BI. Learn more about Enable load in my article here.
Index+1
Before the final operation which is merging. You need to do one more action. And that is adding one to the index value in the main query. This is so that each record can be matched with the record right after. The record with index 1, will then be matched with the record with index 2.
To do this operation. go to the main query (not the new duplicate), and click on the Index Column, and from the Transform tab, under numeric transformations, choose Add.
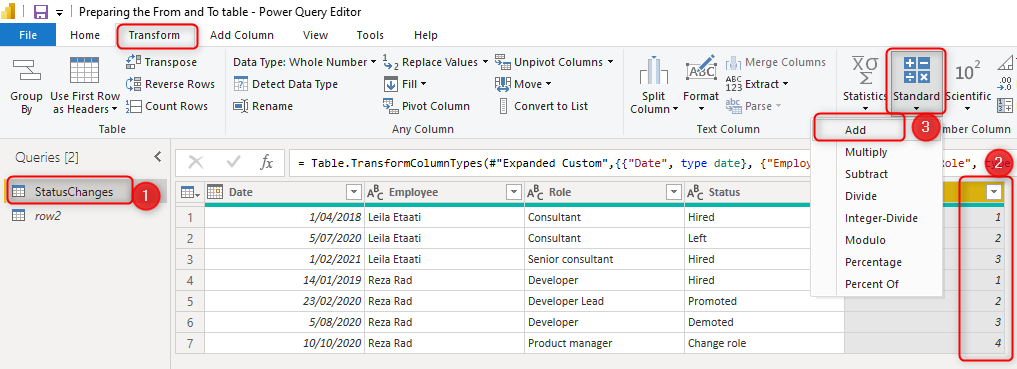
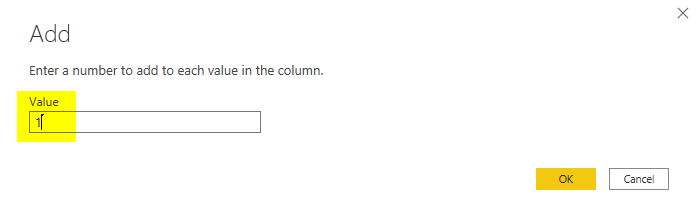
Add one to the current column;
Merge
Now, you can merge the main query with the row2 (duplicated copy) based on Employee and Index column;
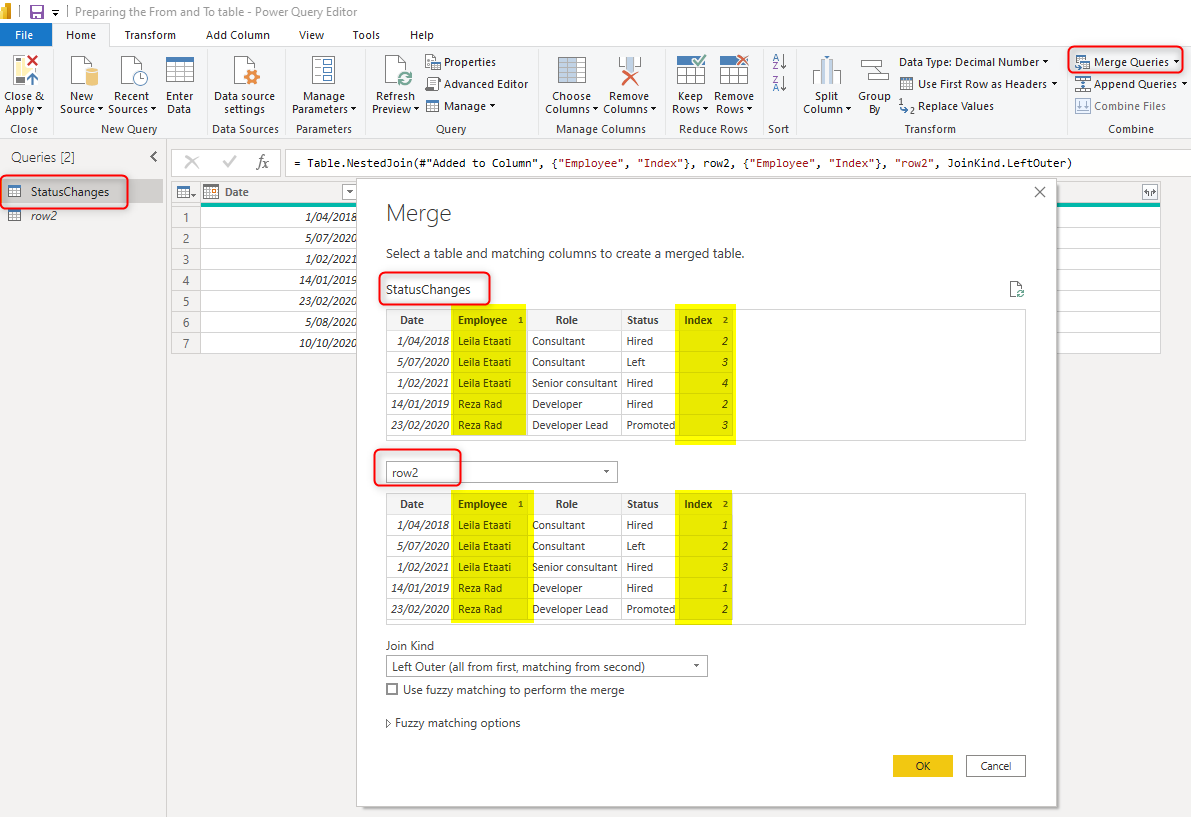
If you like to learn more about combining tables with merge, read my article here.
and finally, you can expand the merged column result;
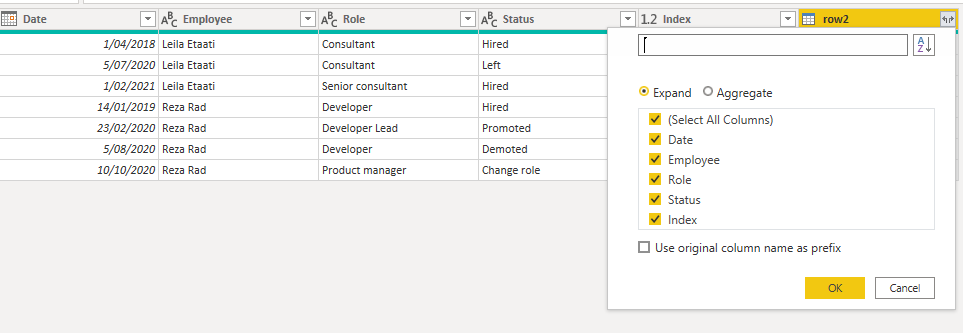
All you need from the expand is the Date column.
And the final outcome is as below;
Note that I have removed the Index column, and renamed the Date column to ToDate.
Summary
The technique mentioned here in this article is useful whenever you want to combine records of a table on a sequence basis. A combination of Power Query transformations is used to achieve this goal. The final outcome table with the FromDate and ToDate normally performs more efficiently than the status log table in the analysis.


Reza is author of more than 14 books on Microsoft Business Intelligence, most of these books are published under Power BI category. Among these are books such as Power BI DAX Simplified, Pro Power BI Architecture, Power BI from Rookie to Rock Star, Power Query books series, Row-Level Security in Power BI and etc.
He is an International Speaker in Microsoft Ignite, Microsoft Business Applications Summit, Data Insight Summit, PASS Summit, SQL Saturday and SQL user groups. And He is a Microsoft Certified Trainer.
Reza’s passion is to help you find the best data solution, he is Data enthusiast.
His articles on different aspects of technologies, especially on MS BI, can be found on his blog: https://radacad.com/blog.
Thank’s a lot of this advice. I got about million rows raw gps- data recently for analyzing and I managed to solve my problem in minutes by following your instructions. This will be a huge time-saver for mein future.
I am glad to hear that Pekka!