

One of the common patterns in Power BI is to have a table with different statuses throughout time and then wanting to get the latest status up to a selected date. A simple example of that is to have a table with position(role) changes of employees and then wanting to see their latest position based on a selection of dates in the slicer. In this article and video, I’ll explain how the pattern works with details of DAX measures.
Video
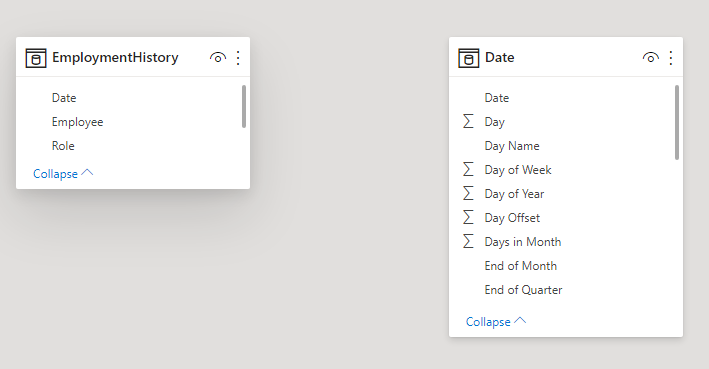
Sample data table: Employment Position History
Let’s assume we have an employment history table like below;
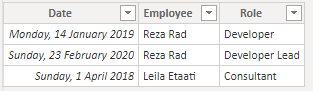
This table has one record per position change of the employee with the effective date of that change. For example; Leila has been a consultant since 1st of April 2018. Reza, however, has been a developer since the 14th of January 2019. His role changed to Developer Lead from 23rd of February 2020.
Requirement: Latest position until selected date
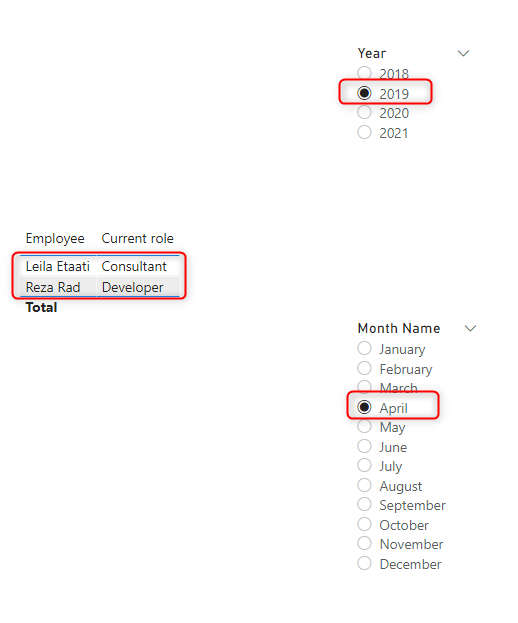
The required output is to select a date in the slicer (or month/year), and see the latest role (position) of the employee at that time;
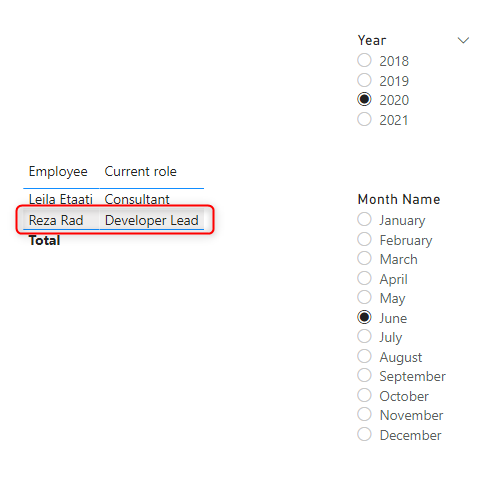
If the report is required for another date, the values might be different. for example, later in 2020, the report will look like this:
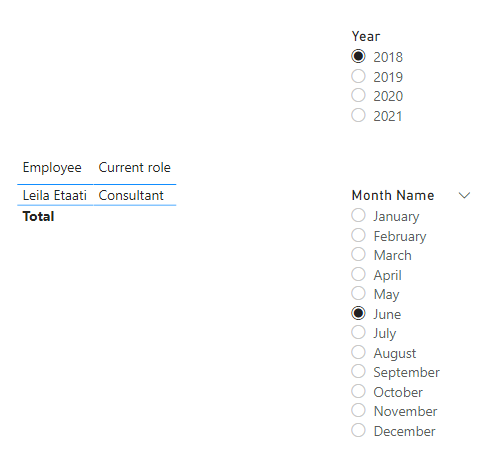
Or if a 2018 date is selected, there is no record of Reza as an employee;
Now that you know the requirement and the data source table, let’s see how it can be achieved.
The model with no relationship to the Date table
For an analysis like the above, you need to have a date table for the slicers. If the Date table is filtering the Date field in the EmploymentHisotry table, then it would become a challenge, because the slicer would filter only that date. meaning that if you select Jan 2019, you will see a record for Reza Rad, but for Feb 2019 you won’t see anything because there is no record in the table for that date. However, Reza is still an employee with the same position in Feb.
For this model, you will need the date slicer not to filter the EmploymentHistory table. In other words, no relationship between the Date table and the EmploymentHistory table. I am using a custom Date table based on the query provided here.
DAX Measures
Because there is no relationship between the Date table and the EmploymentHistory table, you need to infuse the date selection into the EmploymentHistory using DAX expressions.
One way to find out what date is selected is using LASTDATE and FIRSTDATE functions as below;
var _selectedDateRangeEnd=LASTDATE('Date'[Date])
var _selectedDateRangeStart=FIRSTDATE('Date'[Date])
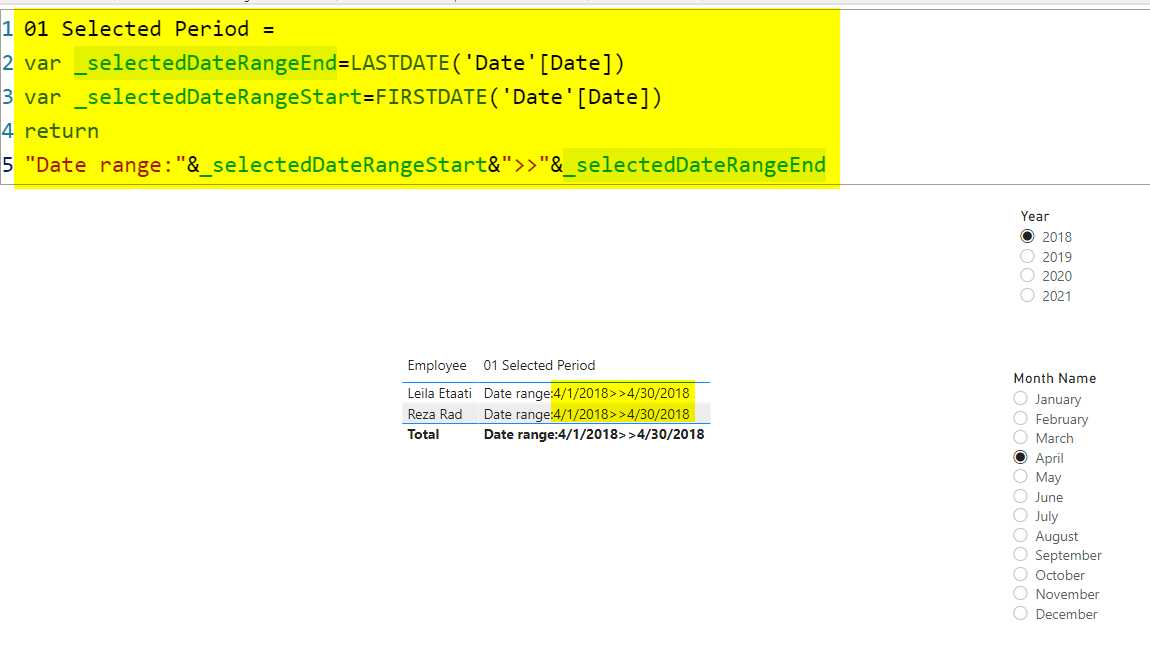
The above two lines are creations of two variables. You can learn more about variables in my article here. In my slicers, I have enabled the single-select, which means the maximum range of a period will be a month. I then show this result in the table just to check how it is populated;
01 Selected Period =
var _selectedDateRangeEnd=LASTDATE('Date'[Date])
var _selectedDateRangeStart=FIRSTDATE('Date'[Date])
return
'Date range:'&_selectedDateRangeStart&'>>'&_selectedDateRangeEnd
Now that we know what date range is selected, we need to find all employment history records BEFORE that date. I assume we are after anything based on the date range’s END date.
var _EmploymentsBeforeDateRange=FILTER(
    EmploymentHistory,
    EmploymentHistory[Date]<=_selectedDateRangeEnd)
The variable above returns a table with all records for the employee that the date is less than the selected date’s range end.
To find out the latest position (role), we first need to find the date of the latest position (role). This can be done with an expression like below;
var _LastRoleChangeDate=MAXX(_EmploymentsBeforeDateRange,EmploymentHistory[Date])
The maximum date in the _employmentsBeforeDateRange table is the latest role’s date.
Now that we have this date, you can use a simple expression like below to get the position of that using the LookupValue function;
var _lastRole=LOOKUPVALUE(EmploymentHistory[Role],EmploymentHistory[Date],_LastRoleChangeDate)
return
The expression above simply fetches the Role of the record that the Date of it matches the latest position’s date.
This can be then used in the output of the expression. However, because the measure is visualized in a table, I don’t want the total row to return anything, because this is per-employee analysis. I use a similar method to the trick mentioned here, with the below IF expressions;
return
if(
    COUNTROWS(VALUES(EmploymentHistory[Employee]))=1,
    _lastRole
)
The above expression means; return value when there is one employee in the filter context. Meaning that the total row of the table won’t show anything, but the detail rows would.
Here is the entire DAX measure’s code;
Current role =
var _selectedDateRangeEnd=LASTDATE('Date'[Date])
var _selectedDateRangeStart=FIRSTDATE('Date'[Date])
var _EmploymentsBeforeDateRange=FILTER(
    EmploymentHistory,
    EmploymentHistory[Date]<=_selectedDateRangeEnd)
var _LastRoleChangeDate=MAXX(
    _EmploymentsBeforeDateRange,
    EmploymentHistory[Date])
var _lastRole=LOOKUPVALUE(
    EmploymentHistory[Role],
    EmploymentHistory[Date],
    _LastRoleChangeDate)
return
if(
    COUNTROWS(VALUES(EmploymentHistory[Employee]))=1,
    _lastRole
)
This returns the latest position (role) up to the selected date range as below;
You can also use another expression to get the role change history as below;
var _RoleChangeHistory=CONCATENATEX(_EmploymentsBeforeDateRange,EmploymentHistory[Role],'>',EmploymentHistory[Date],ASC)
The expression above concatenate all roles up to the selected date. If you like to learn more about the ConcatenateX function, read this article.
I have added the value of all the variables above in one measure concatenated in order to show you what can be achieved here;
Current role - all in one =
var _selectedDateRangeEnd=LASTDATE('Date'[Date])
var _selectedDateRangeStart=FIRSTDATE('Date'[Date])
var _EmploymentsBeforeDateRange=FILTER(
    EmploymentHistory,
    EmploymentHistory[Date]<=_selectedDateRangeEnd)
var _LastRoleChangeDate=MAXX(_EmploymentsBeforeDateRange,EmploymentHistory[Date])
var _RoleChangeHistory=CONCATENATEX(_EmploymentsBeforeDateRange,EmploymentHistory[Role],'>',EmploymentHistory[Date],ASC)
var _lastRole=LOOKUPVALUE(EmploymentHistory[Role],EmploymentHistory[Date],_LastRoleChangeDate)
return
if(COUNTROWS(VALUES(EmploymentHistory[Employee]))=1,
'Date range: '&_selectedDateRangeStart&'>>'&_selectedDateRangeEnd&'
Count Rows Employment History: '&COUNTROWS(_EmploymentsBeforeDateRange)&'
Last role date change: '&_LastRoleChangeDate&'
Role history: '&_RoleChangeHistory&'
Last role: '&_lastRole
)

Pattern in general
The above example is part of a common pattern; if you have records per ID of the entity (Employee) with different statuses (roles) changing throughout time (Date). Then you can achieve the change history of the statuses and also the latest status up to the selected date range using the same calculations above. HR employee position is just one of the examples that can be answered this way.
A period of no status: Not hired
Note that if an employee is not hired for a period of time, for example. Reza Rad is not hired for a period of a year in between the changes of the positions, then the above method needs some changes. Ideally in those scenarios, I suggest a START DATE and END DATE for each employee change, which I will explain in another article later.
Download
Download the sample Power BI file from here:
Summary
The pattern mentioned here in this article, Last status to date, is a very useful pattern that can be helpful when you want to achieve the latest status (marked by date) up to the date selected using a Date slicer. This can be simply done by some DAX measures with no relationship to the Date table. If there are periods of no status, then the structure of table may need to be changed, which I’ll explain it in another article.
Let me know in the comments below if you have any questions.


Reza is author of more than 14 books on Microsoft Business Intelligence, most of these books are published under Power BI category. Among these are books such as Power BI DAX Simplified, Pro Power BI Architecture, Power BI from Rookie to Rock Star, Power Query books series, Row-Level Security in Power BI and etc.
He is an International Speaker in Microsoft Ignite, Microsoft Business Applications Summit, Data Insight Summit, PASS Summit, SQL Saturday and SQL user groups. And He is a Microsoft Certified Trainer.
Reza’s passion is to help you find the best data solution, he is Data enthusiast.
His articles on different aspects of technologies, especially on MS BI, can be found on his blog: https://radacad.com/blog.
I have been searching for this solution for 3 whole days – thank you so much. I am a HR analyst
It would be great to get a very quick run down on how to use both start and end date. I am working on a project and desperately need to know how to do this. This is such a fantastic resource – Thank you!!
Hi
please check my article here about how this works with start and end date
Cheers
Reza