
In this post series, I am going to show how to use new Q&A visuals for the aim of creating easy visuals by typing the natural language and define some user-defined terms and how to manage it.
This visual is now generally available for everyone.
IN this post some introduction to this visual about how you can write a sentence and created a visual in your report.
Simple Visual
my dataset is about the customer feedback about our service, they rate us High or low. Customer information like company size, the role of the customer in organization, tenure and so forth.

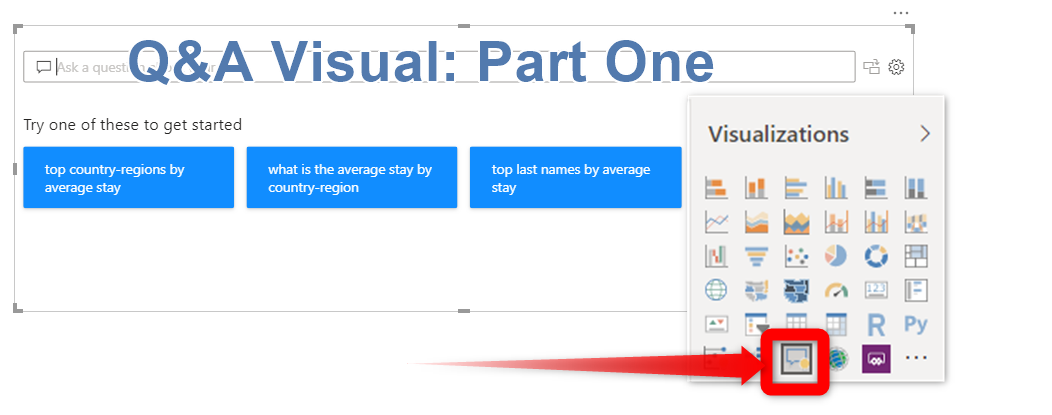
now I am going to create a visual by click on the panel
or simply double click on the white screen in the Power BI desktop page
so you should see below screen
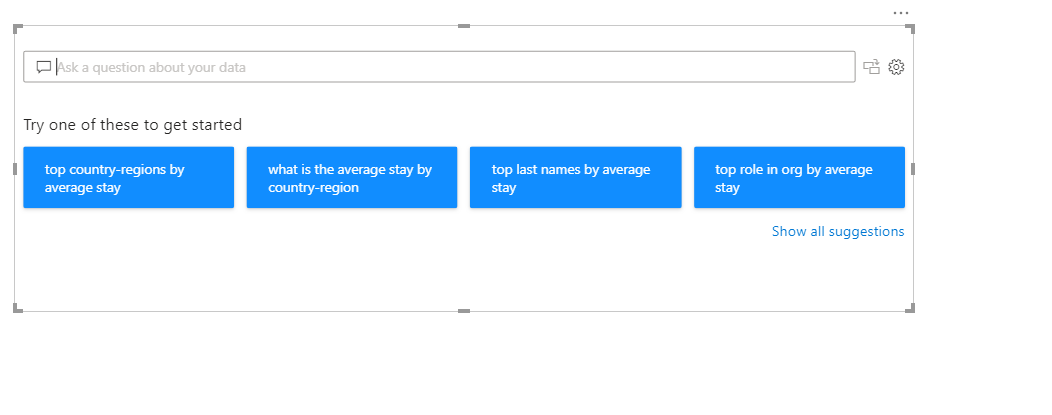
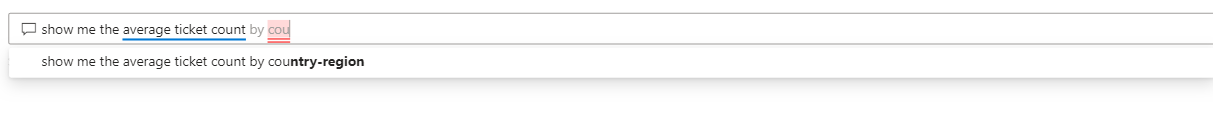
in the textbox, you can ask the question
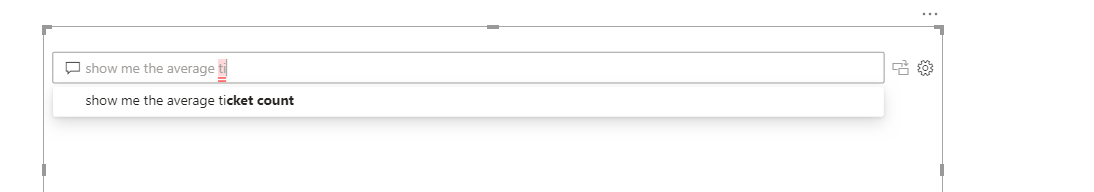
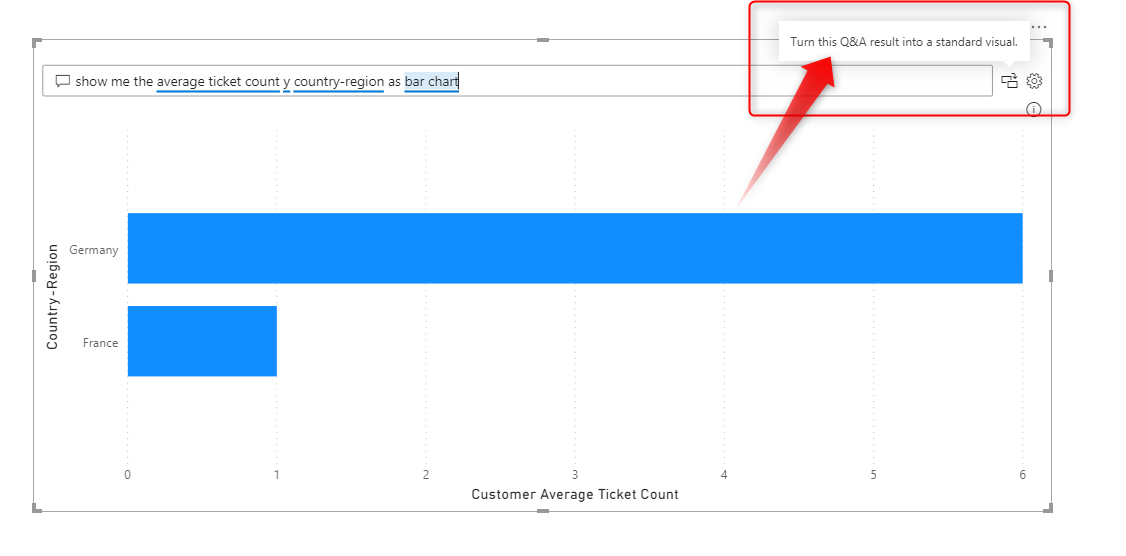
I am going to type below question: “Show me the Average Ticket Count by Country-region as Pie chart”, I start to type and as you can see in the below picture the Q&n understand the ticket count term from my type,
Next, I want to show this average by each country and region so I use the By
command and then the country-region
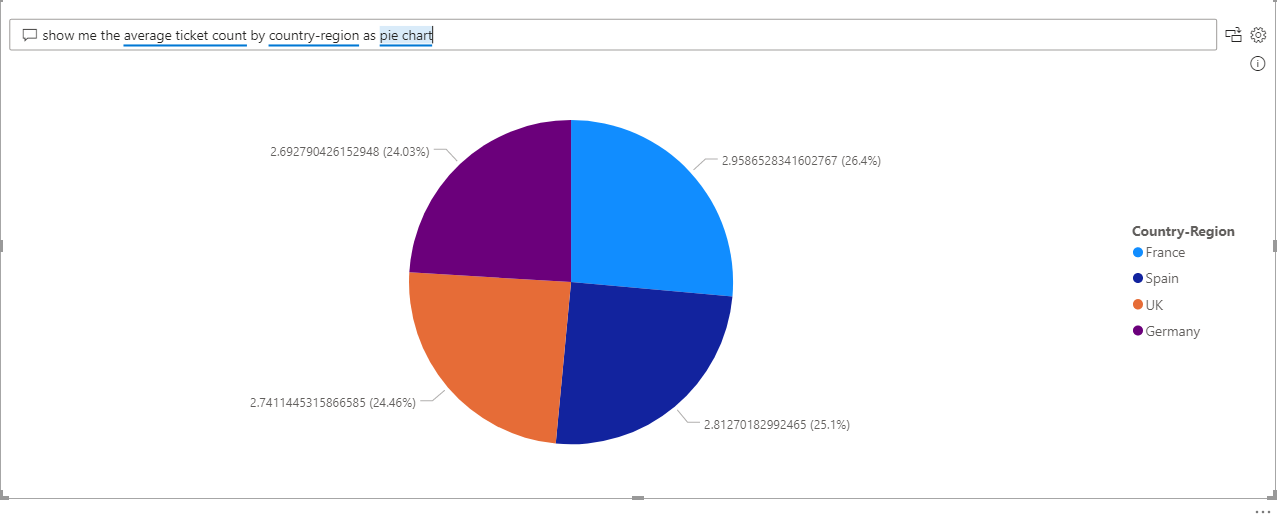
the chart can be a pie chart, so I start to type “as Pie chart”
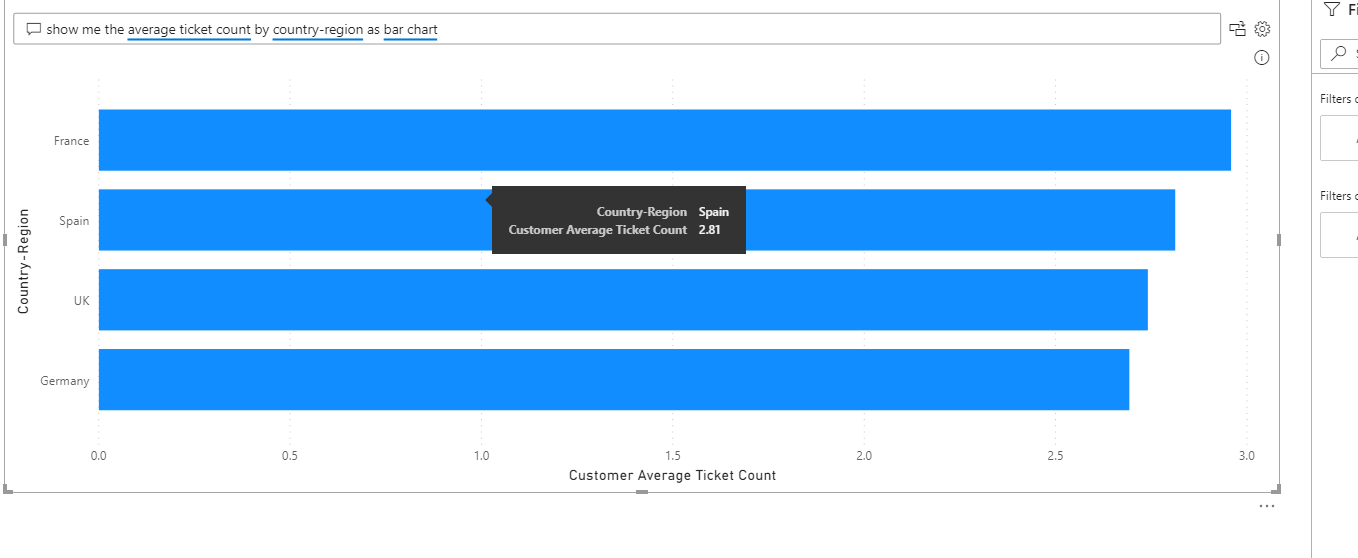
you can change to other types of the chart as a bar chart
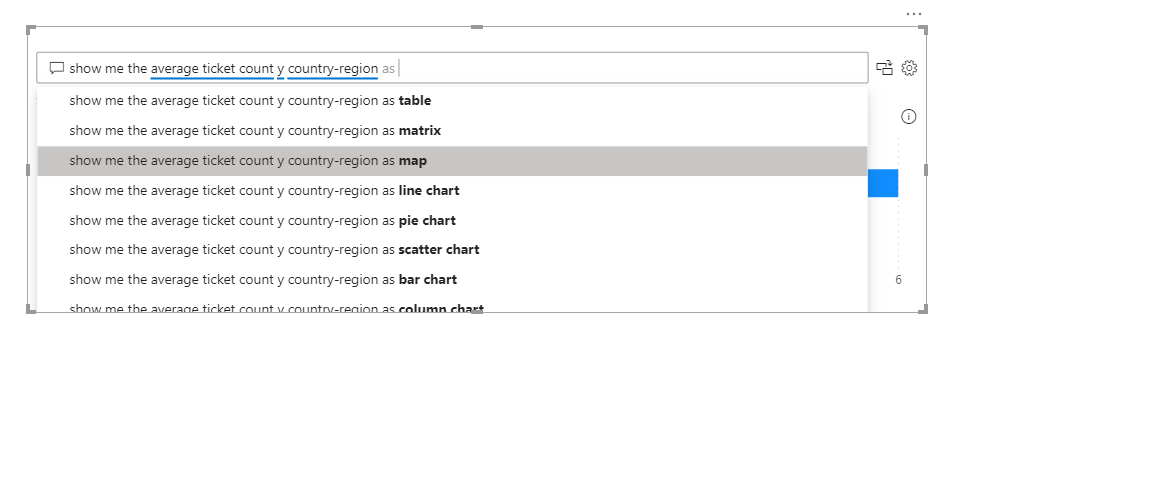
you can choose any chart from table to matrix
Next, after creating the visual, just click on the icon on the right side of the visual to make it as a normal visual.
Next, you can see the visual in your report, you could not back to edit the visual.
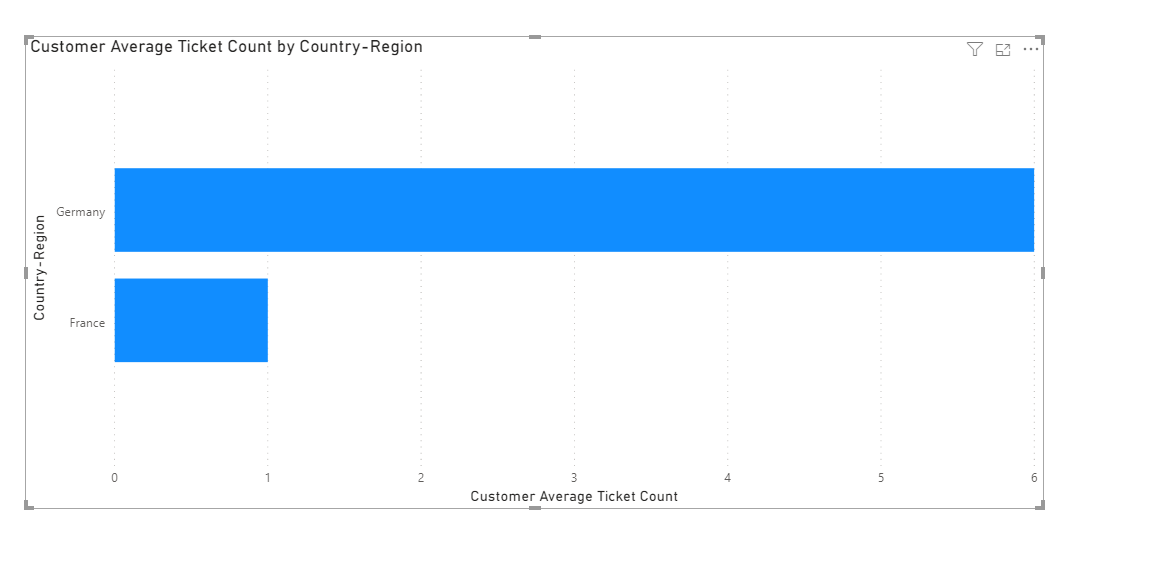
It is a simple use of the Q&A visual in Power BI desktop that we already have it in the Power BI service dashboard.
In the next blog post, I will show how to use custom terms in the ask question text box and manage the terms.


