
If you use a field in a visual and based on a combination of slicer selection, that field doesn’t have any value, you might see blank in the visual. If you want to replace that blank to zero, here is a trick for you. a very simple trick that you can use anywhere easily.
Sample Report
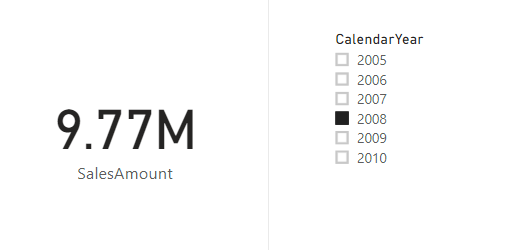
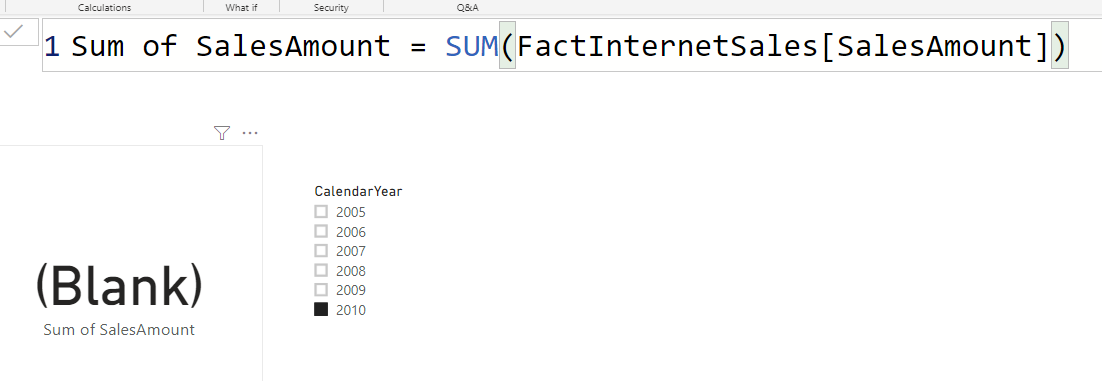
I have a sample report here that shows the SalesAmount (which is a field in the FactInternetSales table of the AdventureWorksDW excel file) as a card visual, which a slicer for Calendar Year (DimDate);
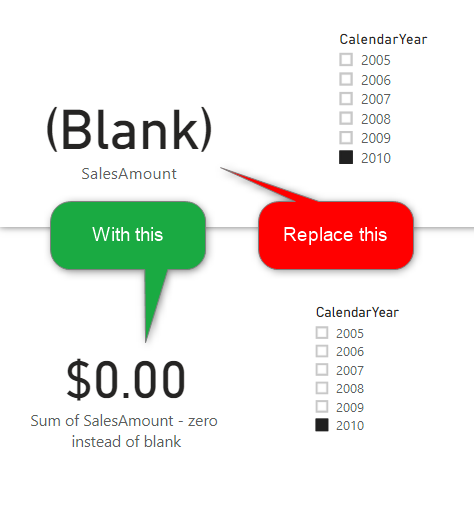
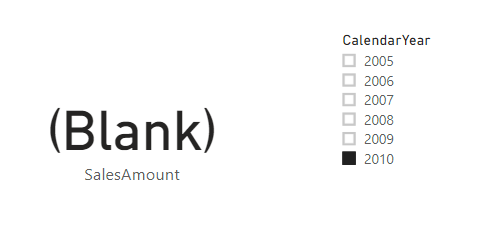
The problem is that if I select a year such as 2010, I get the SalesAmount as Blank:
So, what is the solution? really simple. using a DAX measure. let’s see.
Creating a DAX Measure
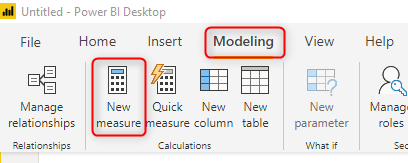
One easy way to replace the (Blank) with zero or anything else, is to use a measure. You can create a measure in the Modeling tab;
Then write the DAX expression of the measure like this:
Sum of SalesAmount = SUM(FactInternetSales[SalesAmount])
So far, this should give you simply the same output if you use it in the visual;
Now you can add a conditional statement like this:
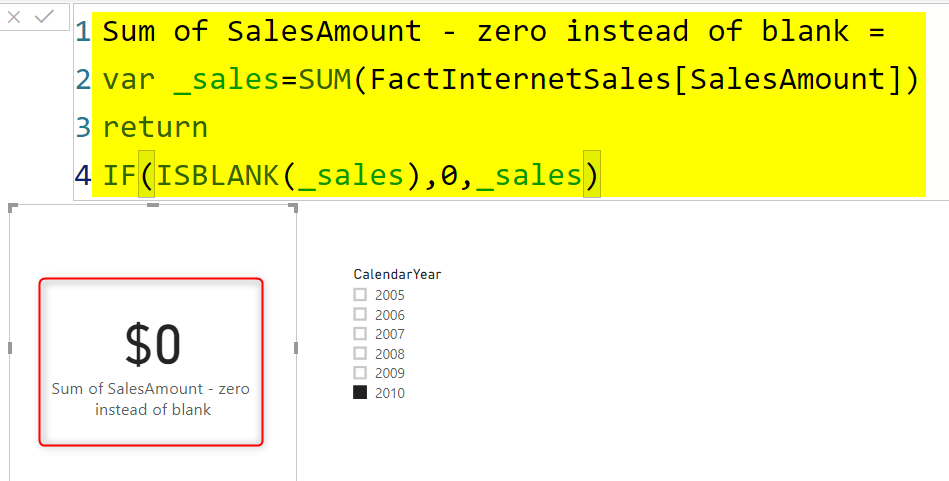
Sum of SalesAmount - zero instead of blank =
var _sales=SUM(FactInternetSales[SalesAmount])
return
IF(ISBLANK(_sales),0,_sales)
The expression above might looks scary if it is the first time you are writing a DAX statement. However, when you look at it in detail, It is using a variable for the sum of the SalesAmount field, then checks to see if the result is blank or not, if blank, it returns zero, otherwise the sum of SalesAmount. Using the variable makes your code easier to read and faster. however, it can be done also without a variable like this:
Sum of SalesAmount - zero instead of blank - no variable =
IF(
    ISBLANK(SUM(FactInternetSales[SalesAmount])),
    0,
    SUM(FactInternetSales[SalesAmount]))
Now, if I use that measure in the card visual, I get zero instead of blank.
There are a few points to consider when you are doing this change:
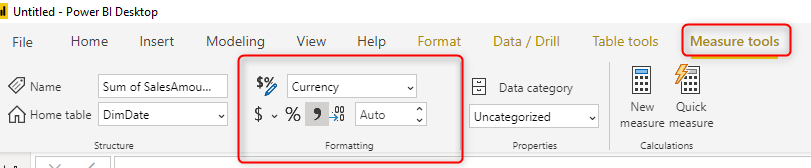
Make sure you format the measure correctly in the Measure tools tab
depends on the data type and desired format, select the right formatting in the measure tools tab.
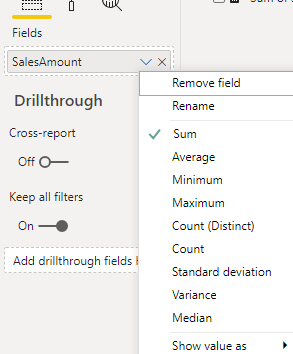
Aggregation is not always SUM
Depends on what is the default aggregation of the field you have used in the visual, you have to use the same aggregation in the measure. If aggregation is Average, then use the Average Function and so on.
This method does not replace the blank in the data row
This method just presents the blank as zero in a visual. Behind the scene in your data rows, data is still in the same shape as it was before.
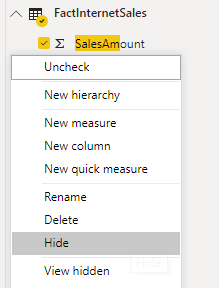
Hide the Original Field
After creating the measure of your data field, then you better to hide the original field, because you won’t use it any more directly. the measure is what you can use from now on.
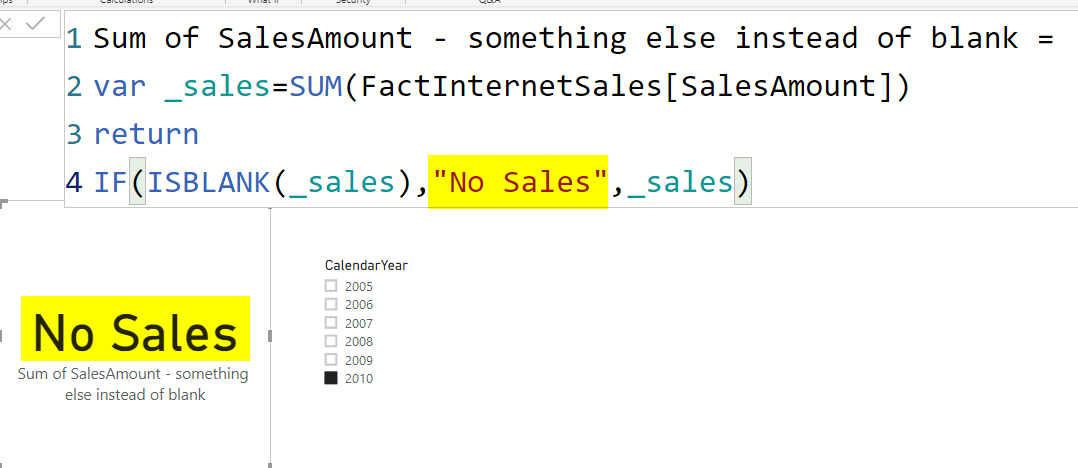
Replace Blank with Other Values
If you want to show something else instead of blank (not zero), you can use that in your expression, such as below;
Be careful of using this method in other visuals
This method works perfectly for some visuals which shows only one value, such as Card, Gauge, KPI visual, etc. However, if you use it in a visual with an axis, then you might get undesired results.
here you can see an example:
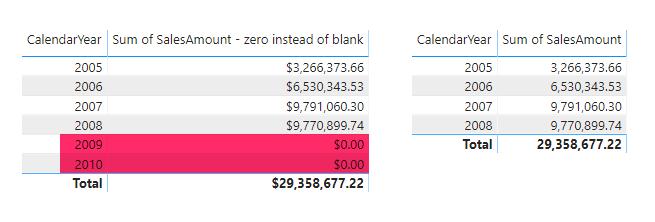
Returning a value instead of blank means that in a visual with an axis (table, matrix, column/bar charts, etc), if for a combination, there is no data, still the visual will show that with zero as a result.
Download Sample Power BI File
Download the sample Power BI report here:
Video


Reza is author of more than 14 books on Microsoft Business Intelligence, most of these books are published under Power BI category. Among these are books such as Power BI DAX Simplified, Pro Power BI Architecture, Power BI from Rookie to Rock Star, Power Query books series, Row-Level Security in Power BI and etc.
He is an International Speaker in Microsoft Ignite, Microsoft Business Applications Summit, Data Insight Summit, PASS Summit, SQL Saturday and SQL user groups. And He is a Microsoft Certified Trainer.
Reza’s passion is to help you find the best data solution, he is Data enthusiast.
His articles on different aspects of technologies, especially on MS BI, can be found on his blog: https://radacad.com/blog.
You could also add a “+ 0” to the end any measure, and remove the need to add the “if” statement at the end of the measure. Effectively the same when 0 should be displayed in favor of the “(blank)”
if you just want it to change to zero, yes. that is another way.
However, ISBLANK and IF give you another alternative to say “No Sales” etc if you want.
also; you need to create the measure anyways, even for adding the zero
Cheers
Reza
very nice article, thanks.
How can I do the same for a date ?
(if the date is tagged a a number, it will be displayed like that : “#0.00”)
thanks
Do you mean to show a default date instead of blank?
Cheers
Reza
the methods I use are
sales=SUM(FactInternetSales[SalesAmount])+0 or
sales=SUM(FactInternetSales[SalesAmount]) – 0
That is also a good method.
However, you won’t have the option to replace the zero with “no sales” or things like that if you want.
Cheers
Reza
Thanks Reza,
I remembered having an issue with the replacement of blank with “no sales”. E.g. When I used Compared with same period last year, an error message showed up saying something like can’t compare number with text as “no sales” is text. Do you suggest any solution for that? Many thanks.
Correct
having a text output in a measure that you expect normally a number on it, might cause formatting issues
pros and cons in each method of course
Cheers
Reza
Fantastic Reza, thank-you for this very simple explaination of how a Var works
Thanks Reza for that. as usual i found all of needed solutions here