
The default behaviour of the slicer in Power BI is that it shows the result of OR when you select multiple items. For example, if you have a slicer for product colour, and then you select both “Black”, and “Blue” the result would be all records that have “Black”, OR “Blue”. Of course, you won’t have a record that has two values in one cell, but you might want to see all customers who purchased both “Black” AND “Blue” (in different rows). In this article, I’ll show you a way to achieve having AND condition using a slicer in Power BI. If you want to learn more about Power BI, read Power BI book from Rookie to Rock Star.
The Sample Model
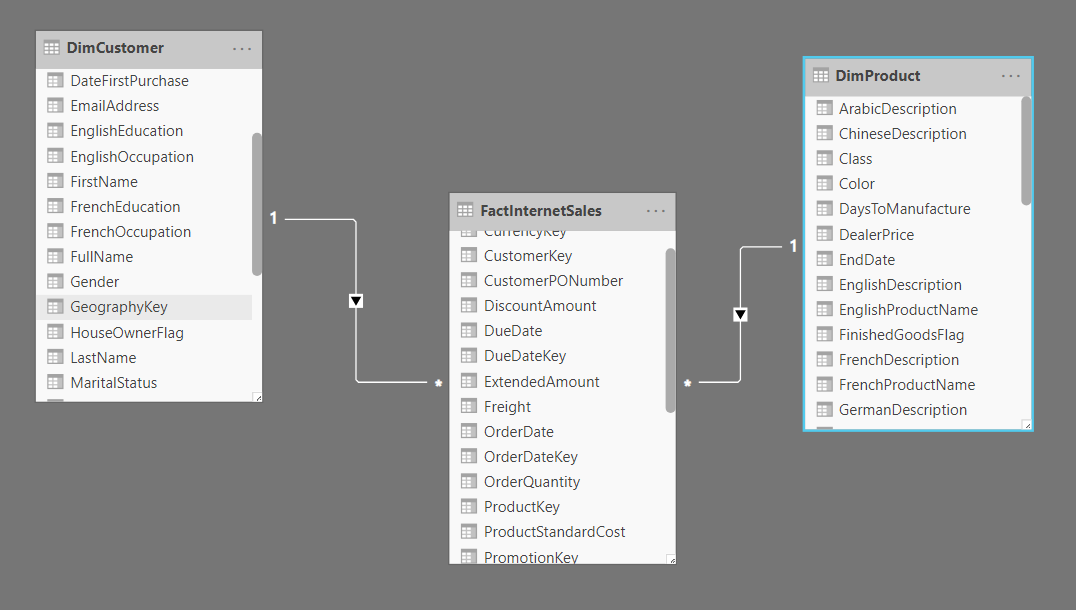
I have a data model built using the AdventureWorksDW2012 dataset, with below tables:
The Requirement (Challenge)
I want to have a visual that shows all my customer’s who purchased ALL the products with selected colours.
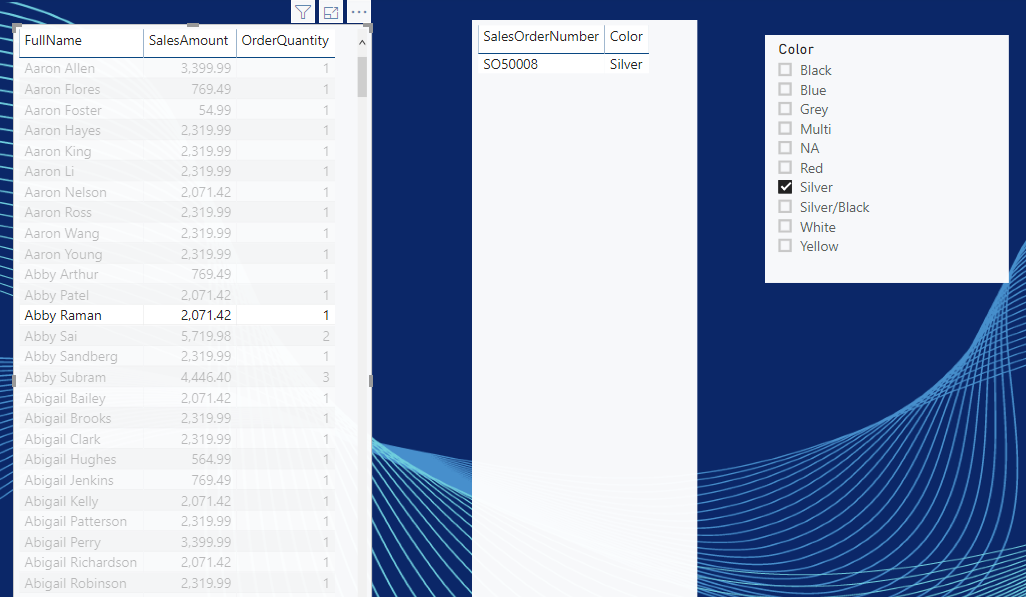
I created a page with a Slicer for colour, and a table visual with the customer’s full name. This works fine as long as I select one colour;
But then when I select multiple colours in the slicer, it shows me all customers who have purchased any of those colours, which means in the below selection, Red, Black, or both.
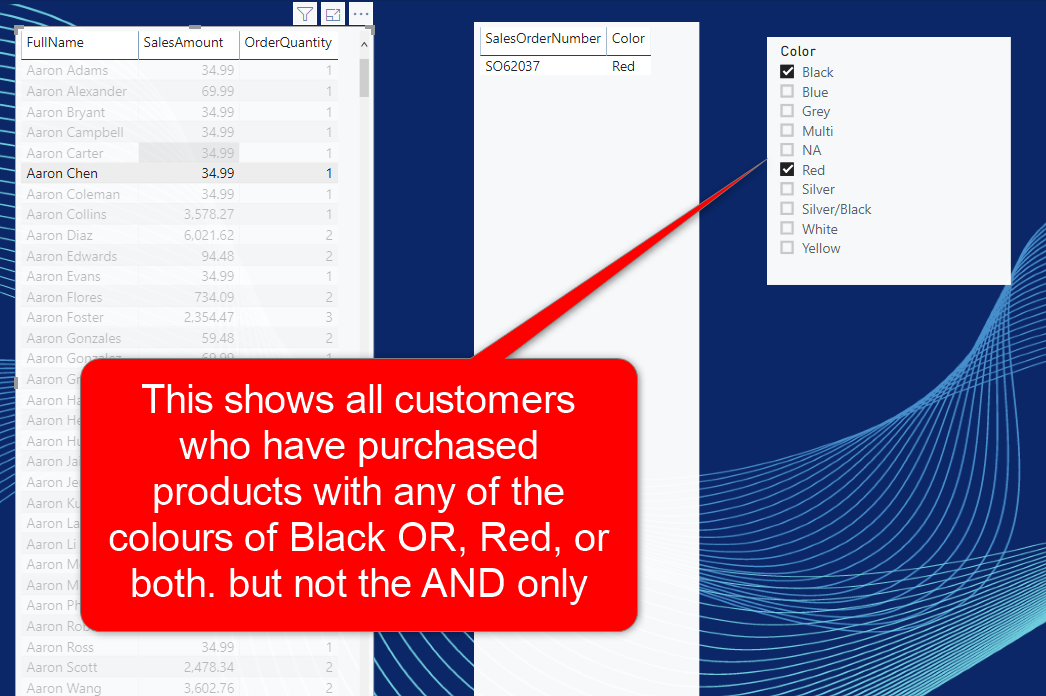
I want to see all customers who have actually purchased products with both colours, which means AND-only condition.
Solution: DAX Measure
There are different ways to solve this challenge, one of them is using DAX calculation as a measure. And when we talk about DAX, there are always multiple methods of writing something. I used a method to first count the count of colours selected in the slicer, then count the distinct number of colours related to products purchased by a customer when it is among that selection criteria, and if the count of that is equal or more than the count of colours show the number. Let’s see that step by step:
Step 1: Count the Selected product colours
This is a measure expression to count the colours
How Many Colours =
var selectedProducts=VALUES(DimProduct[Color])
var countRowsProducts=COUNTROWS(selectedProducts)
return
  countRowsProducts
I actually didn’t need the variable definition, I could do all in one expression, but because I am using the variable in the further steps, I wrote it that way.
Step 2: Filter Records that only have colours within the selection criteria
var selectedProducts=VALUES(DimProduct[Color])
var filtered=
FILTER(
                FactInternetSales,
                RELATED(DimProduct[Color]) in selectedProducts
                )
in the above expression, I used IN operator to check if the colour is within the selected list of colours. Note that the expression here is not a complete experssion, if you write it as measure, you probably get an error. that is only part of the expression. to complete it, continue the next step:
Step 3: Count the Discount colours of products within the selection criteria
From the filtered list, I selected only the product column using the RELATED function in DAX, then I used SelectColumn to only select that column, and finally using DISTINCT I removed duplicated, and using CountRows I get the count of discount colours.
Here is the complete DAX expression
Purchased Products with AND-Only Condition =
var selectedProducts=VALUES(DimProduct[Color])
var countRowsFact=
COUNTROWS(
    DISTINCT(
        SELECTCOLUMNS(
            FILTER(
                FactInternetSales,
                RELATED(DimProduct[Color]) in selectedProducts
                ),
                "Color",
                RELATED(DimProduct[Color])
        )
    )
)
var countRowsProducts=COUNTROWS(selectedProducts)
return
IF(countRowsFact>=countRowsProducts,countRowsFact)

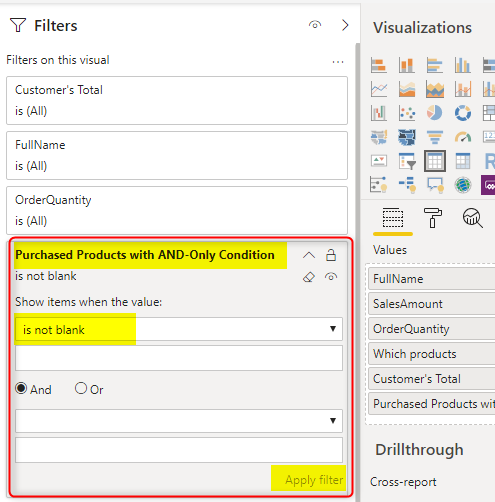
Step 4: Filter by Measure value is not blank
Now, this is a measure that I can use as the Filter for the visual, and in the advanced filter I set that the value Is Not Blank
Testing the result
Now, here is the result, I can only see customers who have purchased all the selected products:
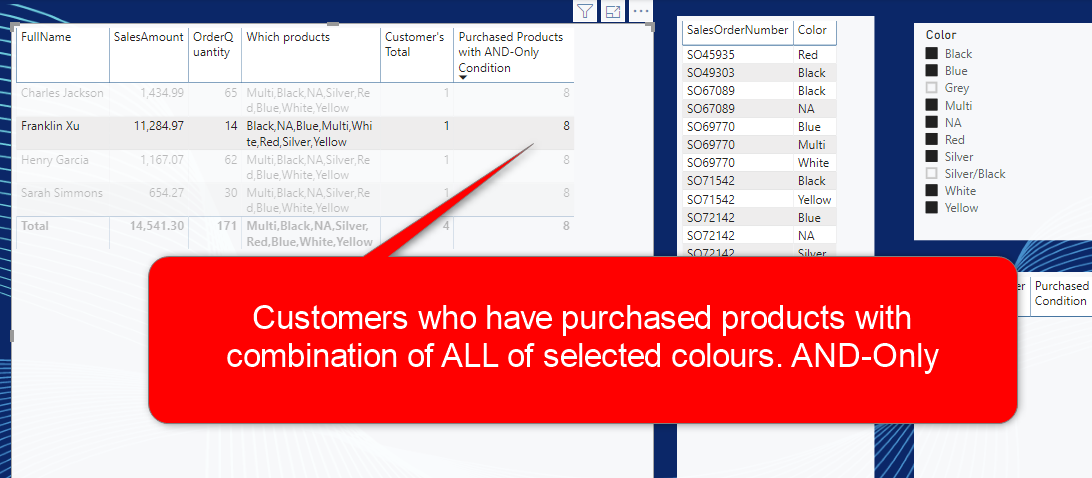
I can change the criteria and see only customers who have purchased at least ALL of the selection criteria


Reza is author of more than 14 books on Microsoft Business Intelligence, most of these books are published under Power BI category. Among these are books such as Power BI DAX Simplified, Pro Power BI Architecture, Power BI from Rookie to Rock Star, Power Query books series, Row-Level Security in Power BI and etc.
He is an International Speaker in Microsoft Ignite, Microsoft Business Applications Summit, Data Insight Summit, PASS Summit, SQL Saturday and SQL user groups. And He is a Microsoft Certified Trainer.
Reza’s passion is to help you find the best data solution, he is Data enthusiast.
His articles on different aspects of technologies, especially on MS BI, can be found on his blog: https://radacad.com/blog.
Very informative and useful….
??
Thank you very much Reza for this trick.
I have only one question, why did you add the sign >= (higher or equal) instead of = (equal) ? Is there a scenario in which we can get a higher value ?
Many thanks,
Hi Hoss
For this visual, won’t get anything like that. so a single = would also work. however, for some other scenarios with a different filter context, we might see a use of that.
Cheers
Reza
Hi Reza,
Thank you veru much.
Hi.
you can tell me, how did you create this measure (Which Products)
Hi, That is using the ConcatenateX to concatenate values. Here is an example of it. You can also use the quick measure for it.
CHeers
Reza
Hello Reza,
I love your work and religiously follow your articles without fail. I’m kinda stuck with same issue as listed above, I wherein I want to filter a table showing list of ‘skill sets’ for set of individuals. In my case the slicer has multi select enabled & expectation is that the table should show ‘ONLY’ those individuals who have at least ALL the ‘Skills sets’ selected in chiclet slicer. If they have more skills than selected, then too they should show up. I replicated your complete DAX but it did not work as expected. I’m getting values in newly created column as total #count of rows for that individual, I the slicer has no impact on the column value, it is not changing dynamically. Additionally, I don’t have a concatenatex col. similar to which product in your case, as skill set values per individual is listed at row level, I one below another.
Please support/guide, how can I solve this issue.
Hi
can you please send your PBIX file to me to have a look?
use the “Contact Us” option to get our email address
Cheers
Reza