
Debugging DAX codes can be sometimes a bit of challenge, especially because measures are dynamic in their nature, and you won’t see their values in the data tab of Power BI, you will see their value when they are evaluated in a visual. Because sometimes measures are using nested functions and tables, the whole process of debugging DAX code becomes even more complicated. In my training sessions, I found that one of the reasons that many people consider DAX as a complicated language to learn is the hardship of debugging it. So here in this article, I am explaining some simple ways to debug your DAX expression in Power BI. If you like to learn more about Power BI, read Power BI from Rookie to Rock Star.
Introduction: Why Hard to Debug?
If you write a simple DAX expression like below:
Sum(FactInternetSales[SalesAmount])
Then the expression looks really simple, however, what makes it a bit challenging, is finding the context of which this expression will be calculated. For calculated columns, the debug process is easier most of the times, because the context that the calculated is evaluated is a row by row context (calculation happens for one row each time), however, even that has exceptions. When it comes to measures, the whole thing becomes harder, because you don’t know how the calculation will be before putting it in a report page.
In addition to the context of which the DAX expressions apply, often in DAX expressions, we use virtual tables. The concept of virtual tables is a name that I made up myself, there is not terminology for that actually. Here is what I mean by virtual table:
What do I mean by Virtual Table in DAX?
There are some functions and calculations in DAX that returns a table. If you use those functions in creating a calculated table, then you have an actual table in Power BI. One of these functions is ALL() for example, I have written a whole article about use cases of that. other examples of this function are SamePeriodLastYear, DatesInPeriod, DatesBetween, and many other functions that all return table instead of a single value. I am not saying that those functions are producing virtual tables. Here is what I mean by a virtual table.
If there is a function or calculation that produces a table as output, and it is used directly in a DAX expression as an input for another function, then you don’t really see the content of that table. That table is what I call a virtual table.
I call this virtual table, some others call it with all other different names, and some event doesn’t call it anything, but use it. The fact is that in DAX it is very common, that you use nested functions. Here is a very simple example of the usage of nested tables or virtual tables:
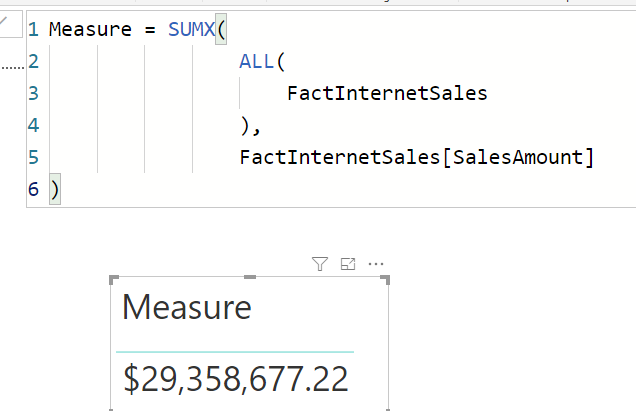
The ALL(FactInternetSales) function is not a real table, It is a table nested into another function, it is a virtual table inside a DAX expression.
How to see the content of Virtual tables
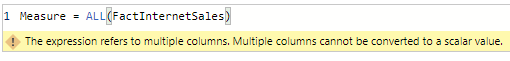
One of the hardships of debugging a DAX code is to find out what is the data in the virtual table. The virtual table is not an actual table that you can see the content of it. It is not also a single value that you can put in a measure and see what is the outcome of that. it is a whole table with columns and rows. And you cannot show a table in a measure as output:
All is probably one of the easiest function to find the context because it ignores the filter, but the process can be much more complicated for other scenarios or functions. I have a set of simple methods that I use when I want to debug a virtual table in DAX. Let’s see what these are. As an example, we can see how they work with a sample. Let’s say I want to see how SamePeriodLastYear function work. (I have written a full article about the difference of those functions, which you can read here. In this article our goal is not finding the difference, but to see how we can debug that code).
Produce Single Value Output from the Virtual Table
Because it is not possible to show the whole table in a measure, you have to find ways to get single values from it, but single values, that can give you an idea of what is in the table. some methods like getting the first value of the table, the last value, the concatenated list, or count of rows in the table.
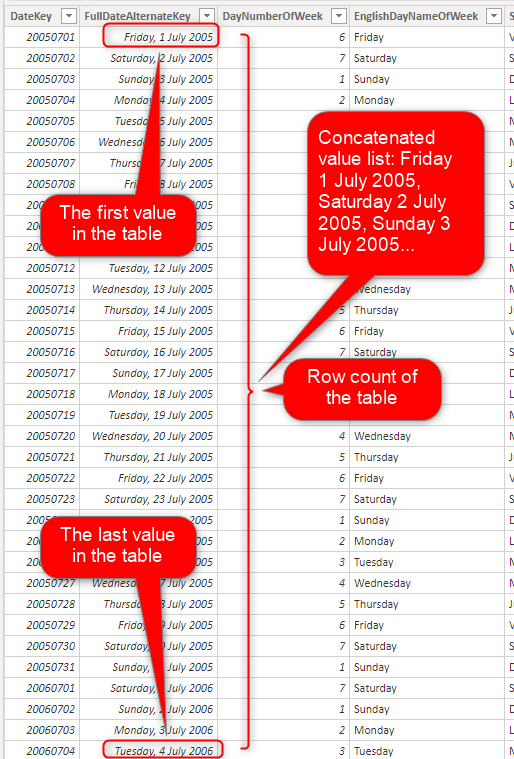
The table that you see in the screenshot above is not a virtual table, it is a real table. However, the process to understand the virtual table’s content is the same. When you use methods to get the first value of the column in the table, or the last value, or count of rows, or concatenated list or any combination of these and any other values, you get a feeling of the content of the nested table.
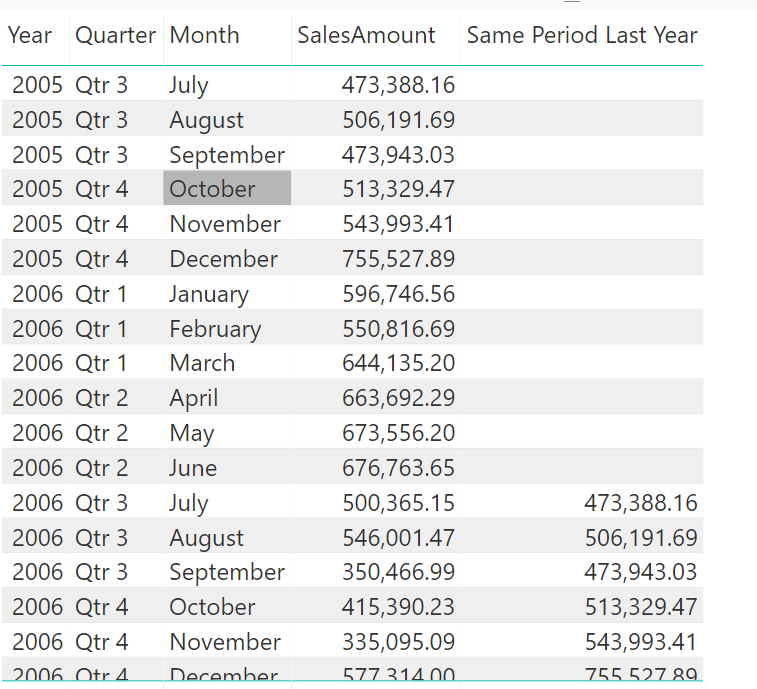
Let’s say I have a measure like this:
Same Period Last Year = CALCULATE(
    SUM(FactInternetSales[SalesAmount]),
    SAMEPERIODLASTYEAR(
        DimDate[FullDateAlternateKey].[Date]))
The part that is not clear for me in the expression is what is actually the period of the SamePeriodLastYear(DimDate[FullDateAlternateKey].[Date])?
Because I don’t see that table, I can use methods like this to get that value:
The First Value
I create a new Measure, and also use variables to get the virtual table into that, then using the FirstDate() function in DAX, I get the first Value of it:
Same Period Last Year Debug =
var vTable=SAMEPERIODLASTYEAR(
        DimDate[FullDateAlternateKey].[Date])
return
    FIRSTDATE(vTable)
Here is the output:
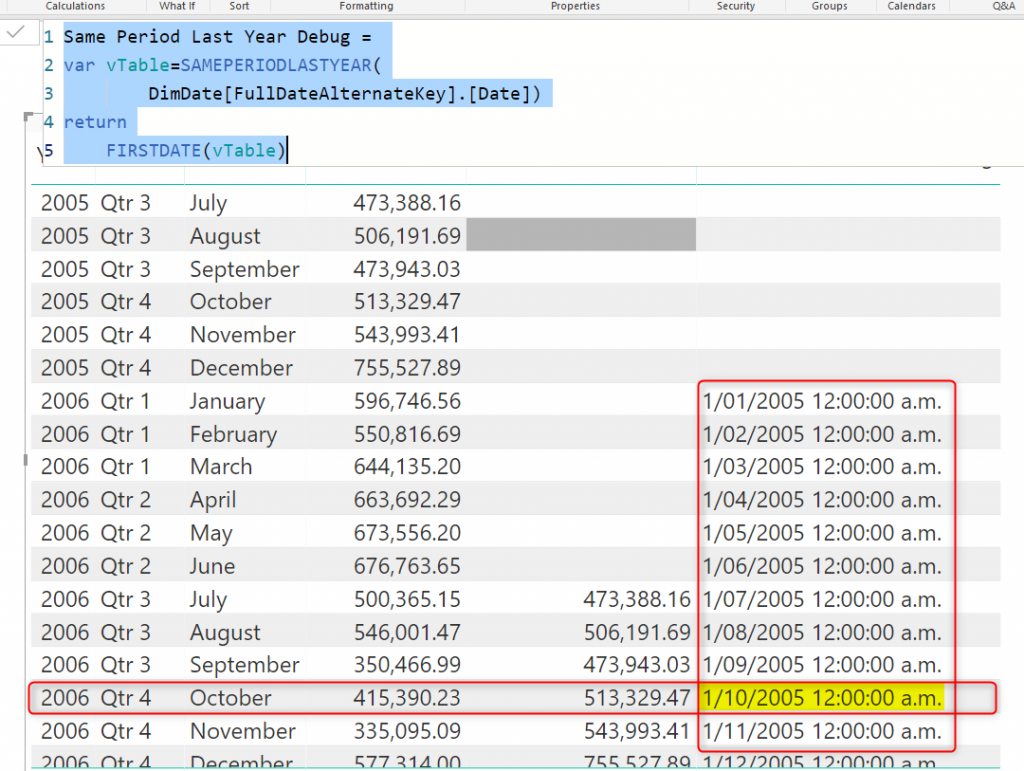
As you see, for any given date in the context of the table, like October 2006, I can see that my virtual table (the table created by SamePeriodLastYear function) is starting from 1st of October for that year.
Using variables can be sometimes tricky however, I’ll write another article about those later. You can achieve the same thing even without variable too. Also, because my values in the virtual table are dates, I used FirstDate function to get the first value, you can also use FirstNonBlank or Min depends on the data type.
The Last Value
I can use the same method to produce the last value, using LastDate, LastNonBlank or Max.
Same Period Last Year Debug =
var vTable=SAMEPERIODLASTYEAR(
        DimDate[FullDateAlternateKey].[Date])
return
    LASTDATE(vTable)
Or even better, you can combine the two (first and last value):
Same Period Last Year Debug =
var vTable=SAMEPERIODLASTYEAR(
        DimDate[FullDateAlternateKey].[Date])
return
    FIRSTDATE(vTable)&" - "&LASTDATE(vTable)
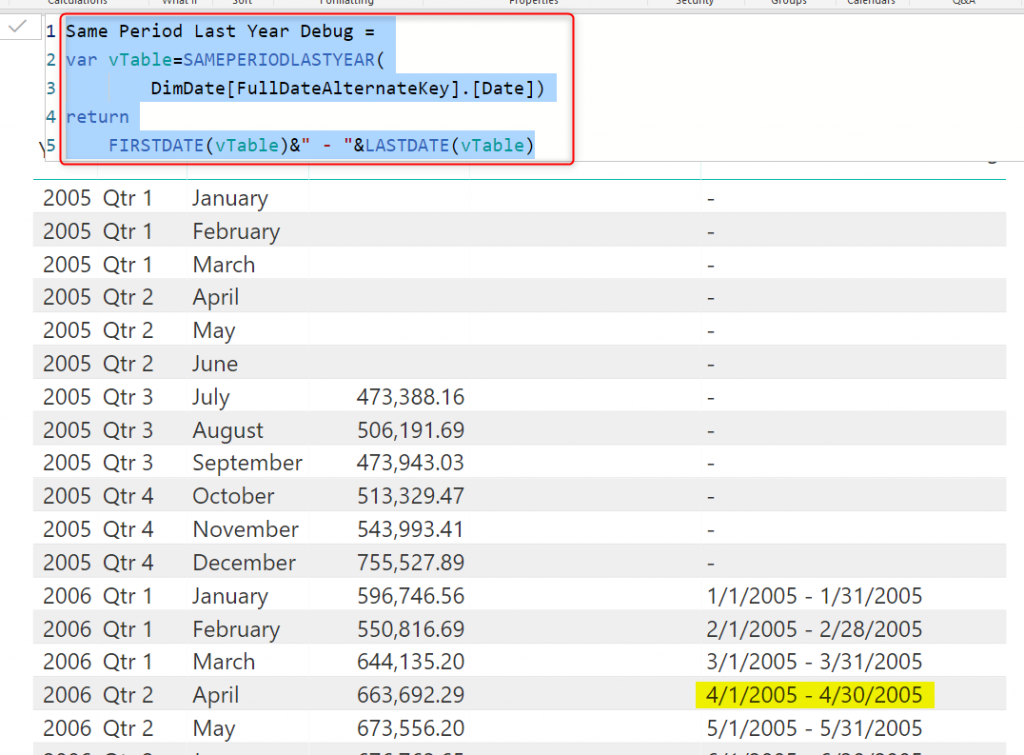
This gives you a clear idea of values in that table because you have the first and the last value visualized now.
The Row Count
Another useful function that I use often is the CountRows, you can also use Count, or CountX or other variations of it. This gives you information about how many rows you have in that table.
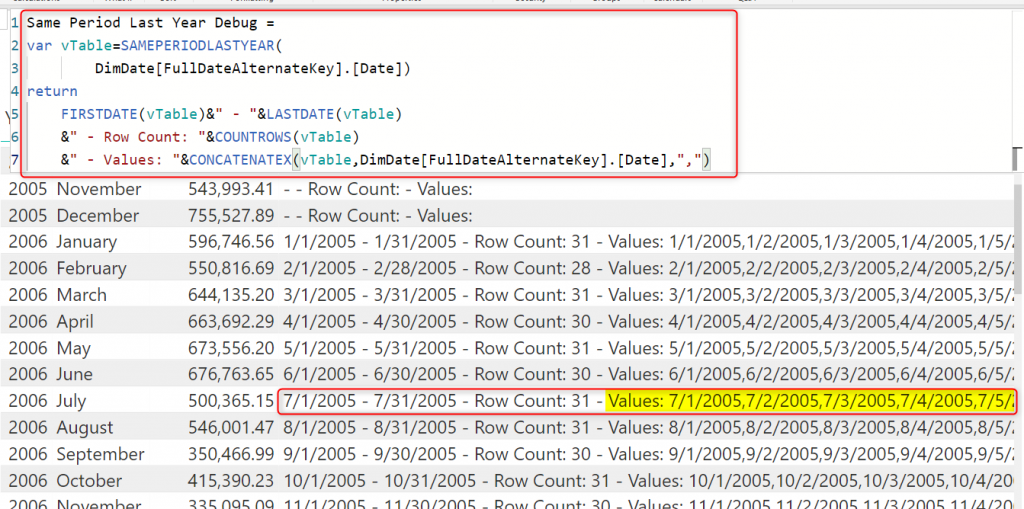
Concatenated Values
Most of the times, I get what I want with only using the first, the last, and the count. However, sometimes, you might need to see every individual value and how they ordered. ConcatenateX is a very good function for that. It gives you those values as a string concatenated value. like this:
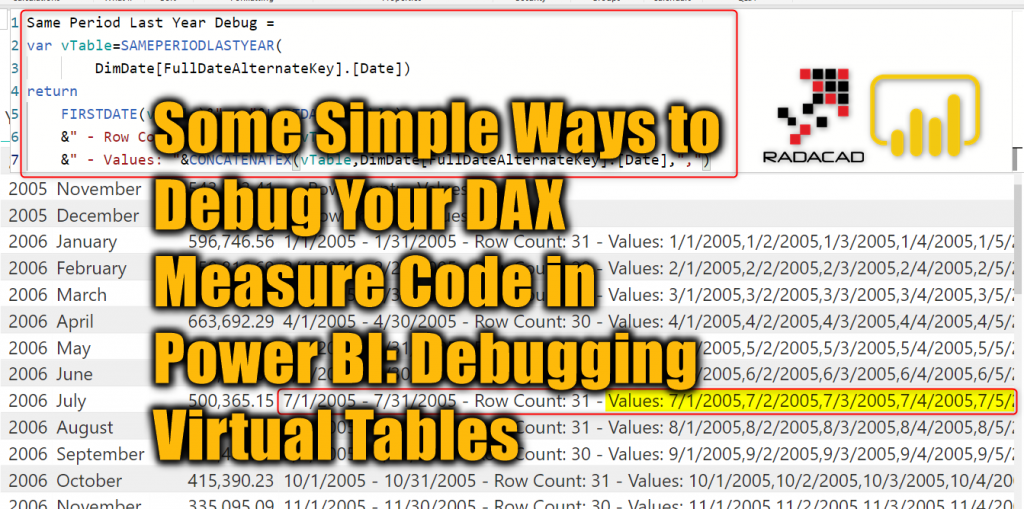
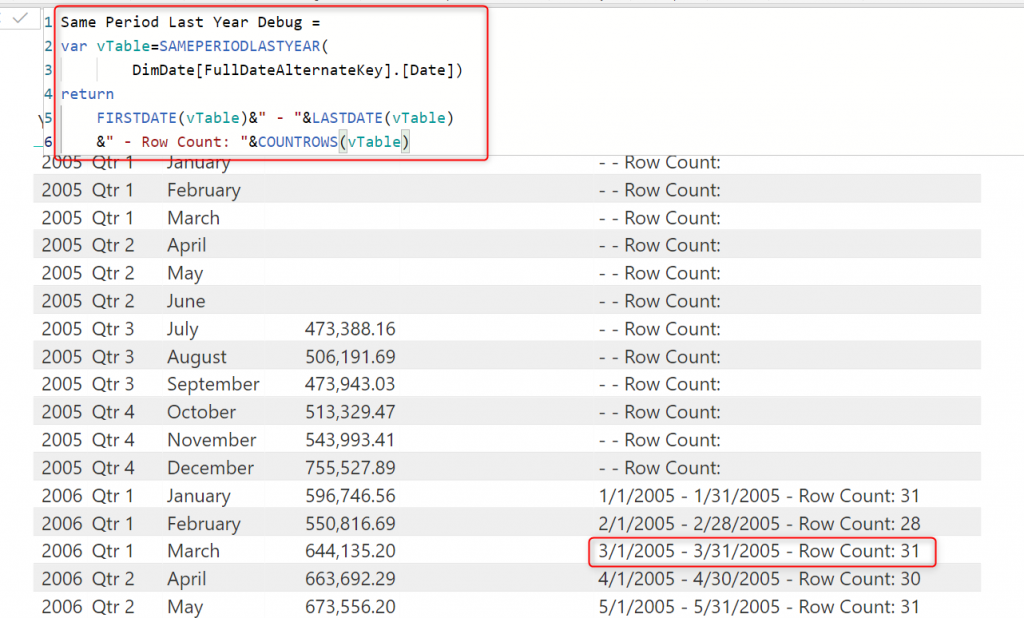
Same Period Last Year Debug =
var vTable=SAMEPERIODLASTYEAR(
        DimDate[FullDateAlternateKey].[Date])
return
    FIRSTDATE(vTable)&" - "&LASTDATE(vTable)
    &" - Row Count: "&COUNTROWS(vTable)
    &" - Values: "&CONCATENATEX(vTable,DimDate[FullDateAlternateKey].[Date],",")
There are many other methods that you can use to get the feeling of what values you have in your virtual table. Methods you have seen here are methods that I use often.
Summary
Inline, nested, or virtual tables in DAX is one of the structures that is a bit of challenge to debug. The trick for those is to produce a single value output of those tables for debug purpose. This method gives you an understanding of what you have in that table. In this article, you have seen how it is simply possible with simple functions such as FirstDate or FirstNonBlank, LastDate or LastNonBlank, CountRows and ConcatenateX to achieve that goal. Are there any other functions that you use? please feel free to put in the comments below.


Reza is author of more than 14 books on Microsoft Business Intelligence, most of these books are published under Power BI category. Among these are books such as Power BI DAX Simplified, Pro Power BI Architecture, Power BI from Rookie to Rock Star, Power Query books series, Row-Level Security in Power BI and etc.
He is an International Speaker in Microsoft Ignite, Microsoft Business Applications Summit, Data Insight Summit, PASS Summit, SQL Saturday and SQL user groups. And He is a Microsoft Certified Trainer.
Reza’s passion is to help you find the best data solution, he is Data enthusiast.
His articles on different aspects of technologies, especially on MS BI, can be found on his blog: https://radacad.com/blog.
This is so useful and it allows me to understand DAX by using it as i now can see inside – even into tables. Thank you