Power BI Issue Fix: Import from Excel Workbook Contents; Password Protection Failure
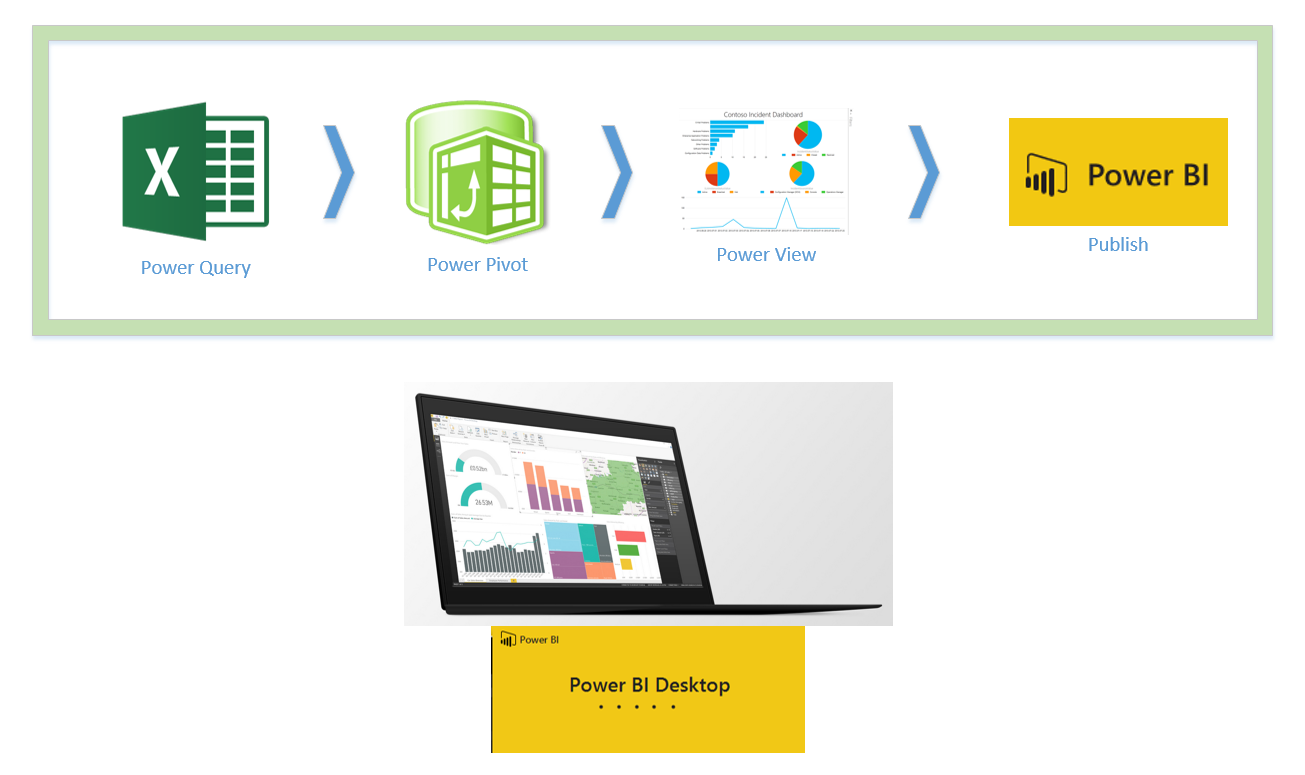
One of the great features of Power BI Desktop is the ability to import your entire Power Pivot Excel model into it. This is an awesome feature, because you can import the entire model including tables, relationships, calculations, and hierarchies into the Power BI. This is a great migration feature from Excel to Power BI. Read more about Power BI Issue Fix: Import from Excel Workbook Contents; Password Protection Failure[…]