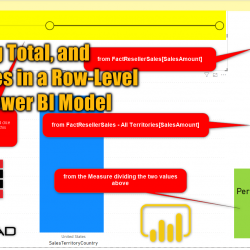
Using Data Category to Have a Better Visualization in Power BI

There are some field properties in Power BI such as formatting, which is obvious to use. However, some configurations on the field level, such as Data Category, is not very well known. Data Category is a configuration that can be helpful in multiple visualizations, In this short article, I’m explaining how to use this option Read more about Using Data Category to Have a Better Visualization in Power BI[…]

Get Images from Web Page Into the Power BI Report Using Power Query

Power Query can connect to a web page and get data from there, and I have explained it before in my article about movies data analysis. However, the default way of getting data from the web page doesn’t fetch images into your report. Images in a webpage come through their own URL. If you can Read more about Get Images from Web Page Into the Power BI Report Using Power Query[…]

Some Simple Ways to Debug Your DAX Measure Code in Power BI: Debugging Virtual Tables

Debugging DAX codes can be sometimes a bit of challenge, especially because measures are dynamic in their nature, and you won’t see their values in the data tab of Power BI, you will see their value when they are evaluated in a visual. Because sometimes measures are using nested functions and tables, the whole process Read more about Some Simple Ways to Debug Your DAX Measure Code in Power BI: Debugging Virtual Tables[…]

Find the Best, Worst, and Middle Values Using Simple Clustering with Power BI Scatter Chart

Machine Learning and AI can be advanced areas, however, there are some easy to use methods for that especially in the Power Platform and Power BI. Leila has written tons of blog articles about AI in Power Platform. However, as a visualization point of view, I want to show you a feature that you might Read more about Find the Best, Worst, and Middle Values Using Simple Clustering with Power BI Scatter Chart[…]

What Fields to Hide in Your Power BI Solution?

To tidy up your Power BI solution, there are some options, and one of them is hiding fields from the report view. This option, although simple, has a significant impact on making your Power BI solution very tidy and clean and easier to maintain. However, you might wonder what are fields that have to be Read more about What Fields to Hide in Your Power BI Solution?[…]

Conditional Column in Power BI using Power Query; You can do anything!

There are many scenarios that you might want to implement a conditional expression. When the conditional expression’s logic is on a row-by-row basis, the best is doing it in Power Query rather than DAX (there are exceptions always), The Add Conditional Column in Power Query is a very helpful option, but often many people find Read more about Conditional Column in Power BI using Power Query; You can do anything![…]

Organize Power BI DAX Measures in Folders

Although very simple, still I see many Power BI reports with no organized way of separating measures. When you use Power BI for a while, you will gradually have more DAX measures and calculations, and having them organized under folders is always helpful. In this very short article, I’ll explain how you can use Display Read more about Organize Power BI DAX Measures in Folders[…]

Budget vs. Actual Model in Power BI: Calculations and DAX

In the previous article, I explained how you can build a data model for budget vs. actual, where the grain of the two fact tables is different. The model works perfectly as a star schema. As long as you slice and dice data in the level of granularity that both tables support, then you don’t Read more about Budget vs. Actual Model in Power BI: Calculations and DAX[…]

Budget vs Actual: Zero Complexity Model in Power BI

When I explain the Star Schema and best practices of data modeling in Power BI, Often I get questions such as what if we want to have budget and actuals in the same data model? what if there are two tables with different granularity? We cannot solve it with simple data modeling and relationships, this Read more about Budget vs Actual: Zero Complexity Model in Power BI[…]

Create a Profiling Report in Power BI: Give the End User Information about the Data

Most of the time, you would like to know how the data quality looks like in your tables. Although, this is a process that you mainly check at the time of data preparation, having such report for end users, is also helpful, because sometimes they see an odd outcome, and wonder where this is coming Read more about Create a Profiling Report in Power BI: Give the End User Information about the Data[…]