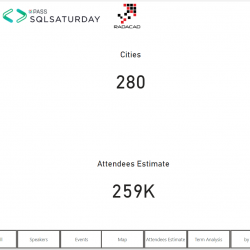
Organize Power BI DAX Measures in Folders

Although very simple, still I see many Power BI reports with no organized way of separating measures. When you use Power BI for a while, you will gradually have more DAX measures and calculations, and having them organized under folders is always helpful. In this very short article, I’ll explain how you can use Display Read more about Organize Power BI DAX Measures in Folders[…]

Budget vs. Actual Model in Power BI: Calculations and DAX

In the previous article, I explained how you can build a data model for budget vs. actual, where the grain of the two fact tables is different. The model works perfectly as a star schema. As long as you slice and dice data in the level of granularity that both tables support, then you don’t Read more about Budget vs. Actual Model in Power BI: Calculations and DAX[…]

Budget vs Actual: Zero Complexity Model in Power BI

When I explain the Star Schema and best practices of data modeling in Power BI, Often I get questions such as what if we want to have budget and actuals in the same data model? what if there are two tables with different granularity? We cannot solve it with simple data modeling and relationships, this Read more about Budget vs Actual: Zero Complexity Model in Power BI[…]

Introduction to Charticulator: Create Custom Visual – Part 1

In the last post different ways of creating custom, visuals have been explained. In this post, I will show how to use Charticulator for creating a custom visual in Power BI. As mentioned, first navigate to the below link: https://Charticulator.com Next, you need to click on the Launch Charticulator. This will navigate you to the Read more about Introduction to Charticulator: Create Custom Visual – Part 1[…]

Create a Profiling Report in Power BI: Give the End User Information about the Data

Most of the time, you would like to know how the data quality looks like in your tables. Although, this is a process that you mainly check at the time of data preparation, having such report for end users, is also helpful, because sometimes they see an odd outcome, and wonder where this is coming Read more about Create a Profiling Report in Power BI: Give the End User Information about the Data[…]

Why my Power BI Matrix or Table Visual is SLOW

You have created a Power BI report with many visualizations and calculations, however, it is slow! And the slowest part of that is the report page with a matrix or table visual in it! Why that visual is so slow? Is this the problem of Visual in Power BI? or Power BI problem at all? Read more about Why my Power BI Matrix or Table Visual is SLOW[…]

Build Your First Star Schema Model in Action: Power BI Modeling Basics

Dimensions and Fact tables are the two essential parts of building a data model, and their relationship in the form of Star Schema is the best practice of doing the modeling. However, these are all theories until you really experience it in a real-world example. In this article, I want to put everything you learned Read more about Build Your First Star Schema Model in Action: Power BI Modeling Basics[…]

Power BI Basics of Modeling: Star Schema and How to Build it

Now that you know about the dimension and fact tables, it is time to talk about one of the most important concepts of modeling. You might have heard about dimensional modeling or star schema, but you may have vague ideas about what it is, or alternatively, you might have used it, but not sure if Read more about Power BI Basics of Modeling: Star Schema and How to Build it[…]

Basics of Modeling in Power BI: Fact Tables

Fact tables are the core of analysis in a data model. In the previous article, I explained what a dimension table is, and why we cannot have everything in one big table. In this article, you will learn about the fact table, and how it positioned in a data model, you will also learn how Read more about Basics of Modeling in Power BI: Fact Tables[…]

Move Your Shared Tables to Dataflow; Build a Consistent Table in Power BI

I have written previously about the use cases of Dataflow in Power BI, and one of them was using one Power Query table in multiple Power BI reports. However, I that article just covered the surface, and I still see many solutions duplicating Power Query scripts in multiple files which brings a lot of inconsistency Read more about Move Your Shared Tables to Dataflow; Build a Consistent Table in Power BI[…]