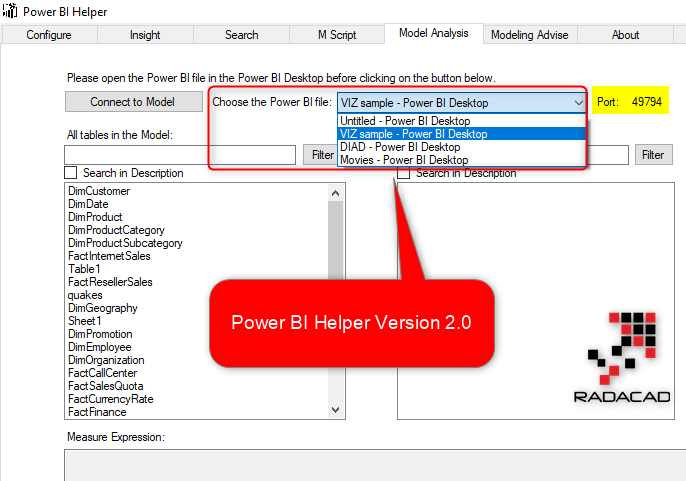
Bookmarks and Buttons: Making Power BI Charts Even More Interactive

In the previous post, I explained a usage of bookmarks and buttons in Power BI, which was for clearing all slicers. Buttons and bookmarks are the gold combination in Power BI. You can do wide range of creative activities with this combination. In this post, I will show you some other usages of buttons and Read more about Bookmarks and Buttons: Making Power BI Charts Even More Interactive[…]

Clear All Slicers in Power BI; A Bookmark Story

Using bookmarks for clearing all slicers in Power BI is not a a new function, I have been using it for many months, and advising many people to do it that way. However, I still get a lot of questions in my presentations about how to do that. That is why I ended up writing Read more about Clear All Slicers in Power BI; A Bookmark Story[…]

Power BI Architecture Guidelines

Implementing a Power BI solution is not just about developing reports, creating a data model, or using visuals. Power BI, like any other technologies, can be used in a correct, or incorrect way. Any technology can be used more effective if it harnesses the right architecture. A right architecture can be achieved after a requirement Read more about Power BI Architecture Guidelines[…]

SQL Server Reporting Services Integration with Power BI

Power BI Report Server can host Power BI reports on-premises, and you’ve learned about it in the previous post. There is another integration between SQL Server Reporting Services and Power BI service; this integration brings tiles from SSRS reports pinned to a Power BI dashboard with scheduled updates from SQL Server agent. The integration of Read more about SQL Server Reporting Services Integration with Power BI[…]

Add Photos to Power BI from Active Directory

If you work for an organisation that stores thumbnail images of staff inside Active Directory, you can probably access these and incorporate the images in your Power BI Reports.  This is a great way of making an internal staff report look fantastic – and it’s easy! Step 1. Click Get Data from the Home tab Read more about Add Photos to Power BI from Active Directory[…]

Power BI Announcements in Data&BI Summit 2018 Dublin Keynote

I am seating in the front row of keynote for Data and BI Summit 2018 in Dublin ran by Dynamic Communities. There will be some great announcements today about upcoming Power BI features. Here in this blog post I will list these features. Incremental Refresh The most wanted feature of Power BI for refreshing data Read more about Power BI Announcements in Data&BI Summit 2018 Dublin Keynote[…]

How to use RANKX in DAX (Part 3 of 3 – The Finale)

Part 1 of 3 Using RANKX in calculated measures Part 2 of 3 Using RANKX in calculated columns This article concludes my epic series detailing how to use the RANKX function in DAX.  In this episode, Frodo finally reaches Mt. Doom and successfully uses RANKX to find the best path into the mountain and complete Read more about How to use RANKX in DAX (Part 3 of 3 – The Finale)[…]

Power BI Export to Power Point: Things You Need to Know

Exporting a Power BI report to PowerPoint is a good way of integrating these two tools together. The analytical power of Power BI combined with the commentary and presentation features of PowerPoint enables you to present your reports differently. You can export almost any Power BI report (limitations mentioned in this post) to PowerPoint, and Read more about Power BI Export to Power Point: Things You Need to Know[…]

How to use RANKX in DAX (Part 2 of 3 – Calculated Measures)

The first article in this series looked at to use the RANKX function in a calculated column to apply ranking to your data. This article will show how you can use the RANKX function in a calculated measure. The PBIX file used for this article can be downloaded here. I will use the same 10-row data-set and Read more about How to use RANKX in DAX (Part 2 of 3 – Calculated Measures)[…]

Usage Metrics or Do It Yourself Power BI Monitoring Report

One of the features of Power BI Service is usage metrics report on a dashboard or report. The usage metrics report will give you an analysis of how many times the content is viewed or share, through which platforms, and by which users. You can also create your own monitoring report based on the model Read more about Usage Metrics or Do It Yourself Power BI Monitoring Report[…]