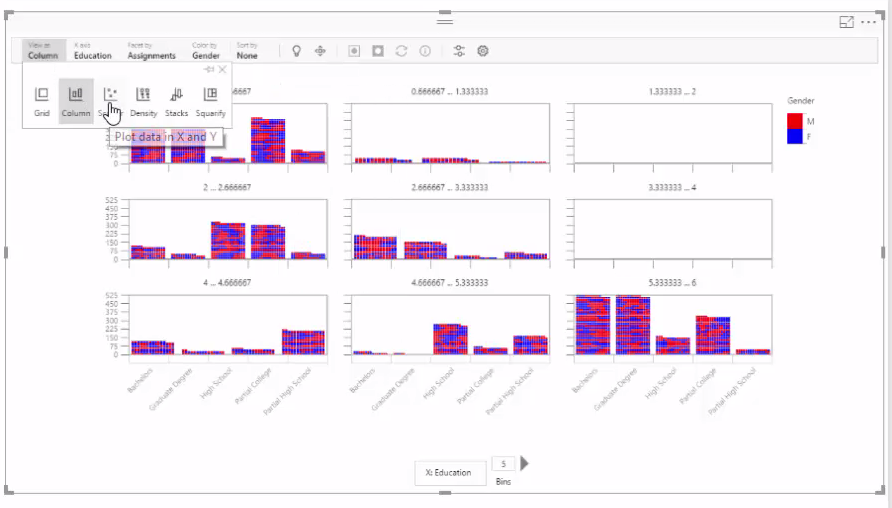
Interactive R Charts in Power BI
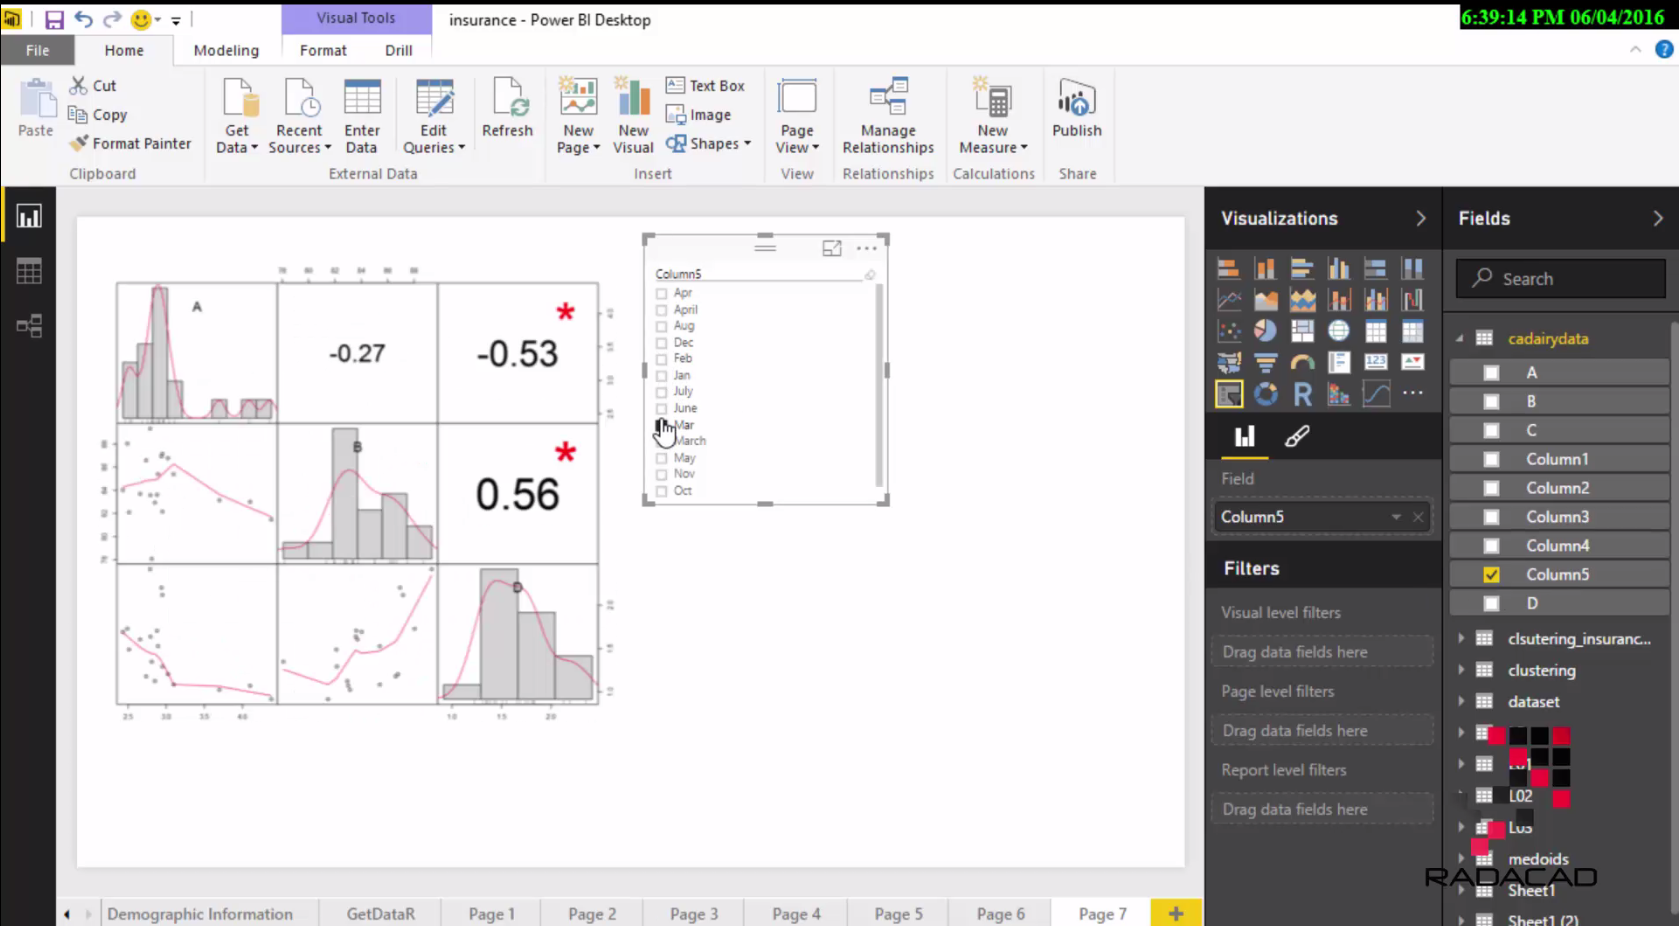
In previous videos you’ve learned that we can demonstrate R visualization in Power BI, In this video you will learn how R visualization is working interactively with other elements in Power BI report. In fact Power BI works with R charts as a regular visualization and highlighting and selecting items in other elements of report Read more about Interactive R Charts in Power BI[…]