Have more Charts by writing R codes inside Power BI: Part 1

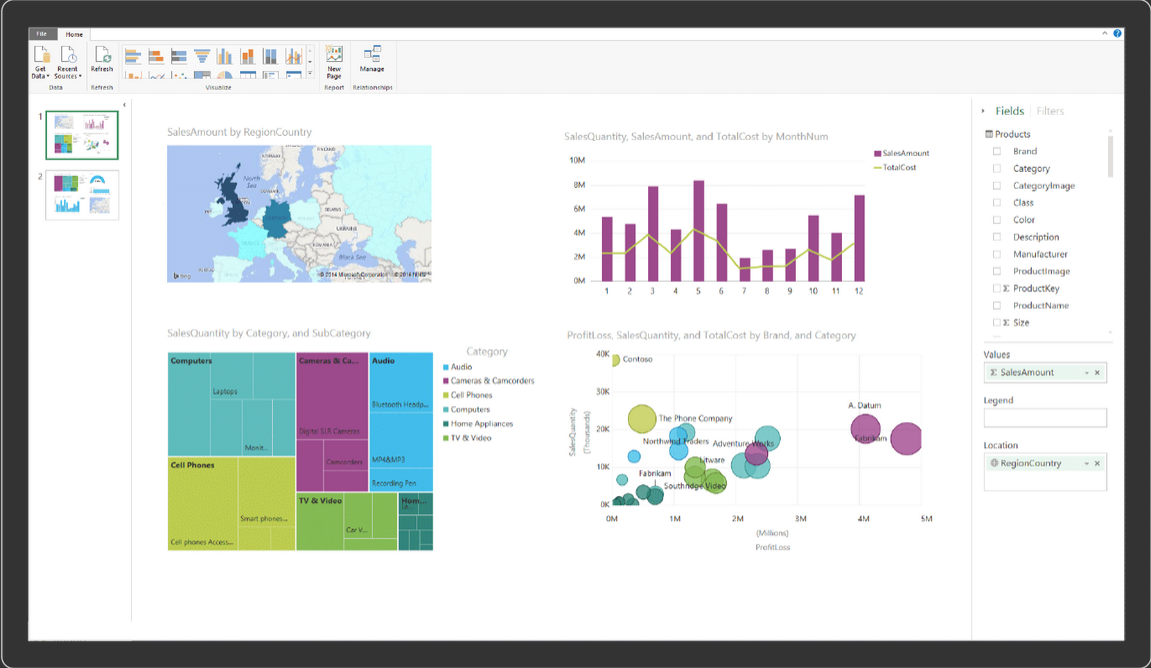
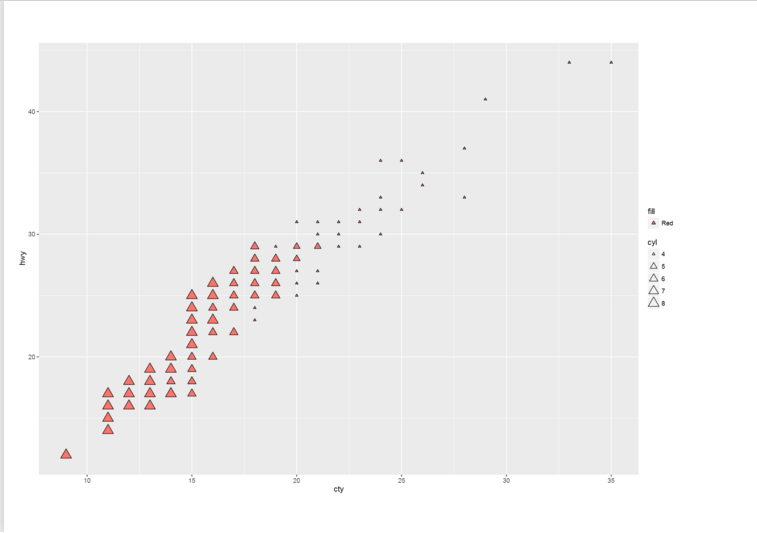
Power BI recently able users to embedded the R graphs in Power BI. There are some R visuals that it would be very nice to have them in Power BI. What is R ? Based on Wikipedia,  R is an open source programming language and software environment for statistical computing and graphics that is supported Read more about Have more Charts by writing R codes inside Power BI: Part 1[…]

Introduction to Power BI Designer

blog

Power BI Designer is the new Editor for Power BI main components which are: Power Query, Power Pivot, and Power View. Power BI Designer made building Power BI solutions easier with an integrated solution. Power BI Designer’s files can be easily uploaded into Power BI site. In this tutorial video you will learn basics of Power BI Designer, some demos of this product, getting data from FIFA 2014 World Cup website, and creating charts and dashboards. In the demo you will also learn how to deploy the report to Power BI site, and how to view the dashboard and report from Power BI app.

[…]

Walk-through Steps: I’m New to BI, Where to Start? – Part 5: Power BI

pbi

Power BI is not a strange word these days, there are many blog posts, videos, news, and speakings about it. Power BI is Microsoft Cloud BI services that released recently. Power BI is not only Cloud BI but also it offers good self-service BI stack as well. Power BI has five main components which are:

  • Power Query: For data extraction, transformation, and load into model.
  • Power Pivot: Data Modelling tool.
  • Power View: Data Visualization tool
  • Power Map: 3D Geo-spatial data visualization tool.
  • Power Q&A: Engine for natural language questions and answering

[…]

Walk-through Steps: I’m New to BI, Where to Start? – Part 4: Data Visualization

logo

Data Visualization is the front end of your BI system. It will be seen from the user’s point of view as the whole BI system! The reason for that is users only will see this part of the BI system, they won’t see Data Warehouse, ETL,  andData Governance… What they see is only dashboards and charts explaining data values. So it is essential to do the data visualization right and effective. A good data visualization should be able to tell story behind the data. A bad data visualization won’t help users even if you have a good data warehouse or ETL design. So you should spent time to analyze ever dashboard, chart, and table and make that a good story teller to the user.

[…]

Power BI Pre-Con; from Rookie to Rockstar

Have you heard about Power BI? Do you know Power BI Components? Have you worked with Power Query Formula language called M? Do you know what are strong capabilities of this language and tool? Have you build PowerPivot models with strong DAX expressions and deployed in Power BI site? Do you know different types of Read more about Power BI Pre-Con; from Rookie to Rockstar[…]

Presentation Materials: TechDays Hong Kong 2014, Power BI Data Visualization with Power Map and Power View

Thanks to all attendees of my session in TechDays 2014 Hong Kong about Power BI Data Visualization with Power Map and Power View. Here is session Title, Description, and presentation file; Title: Power BI Data Visualization with Power Map and Power View Description: Power BI is the most recent BI technology and tool provided by Read more about Presentation Materials: TechDays Hong Kong 2014, Power BI Data Visualization with Power Map and Power View[…]