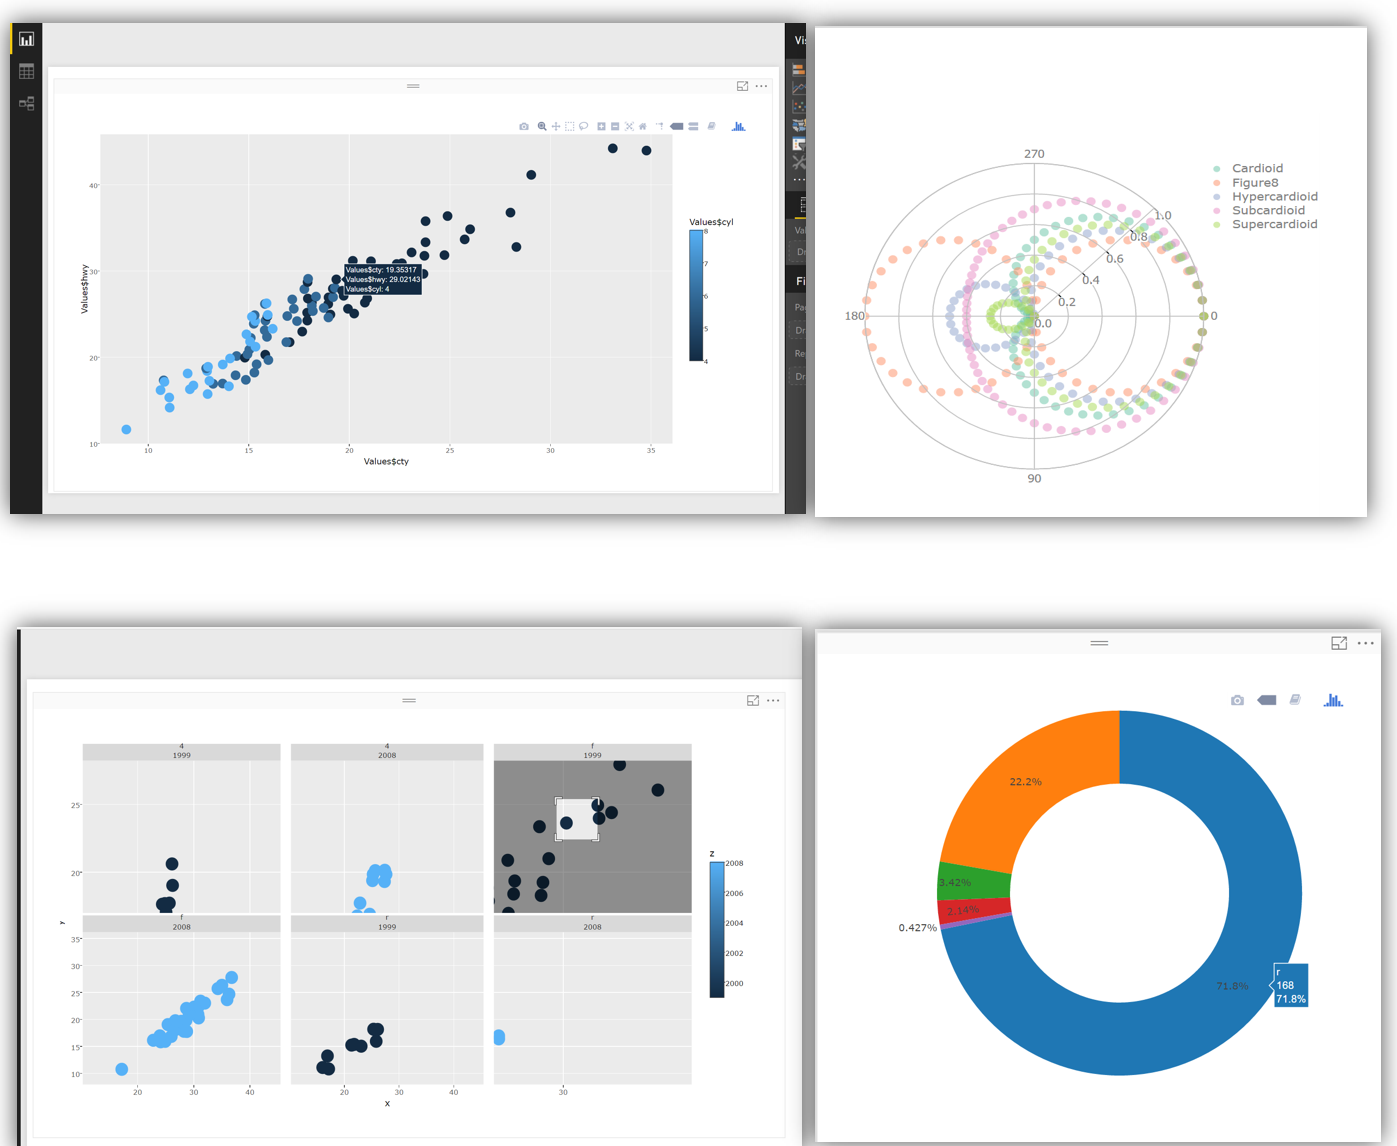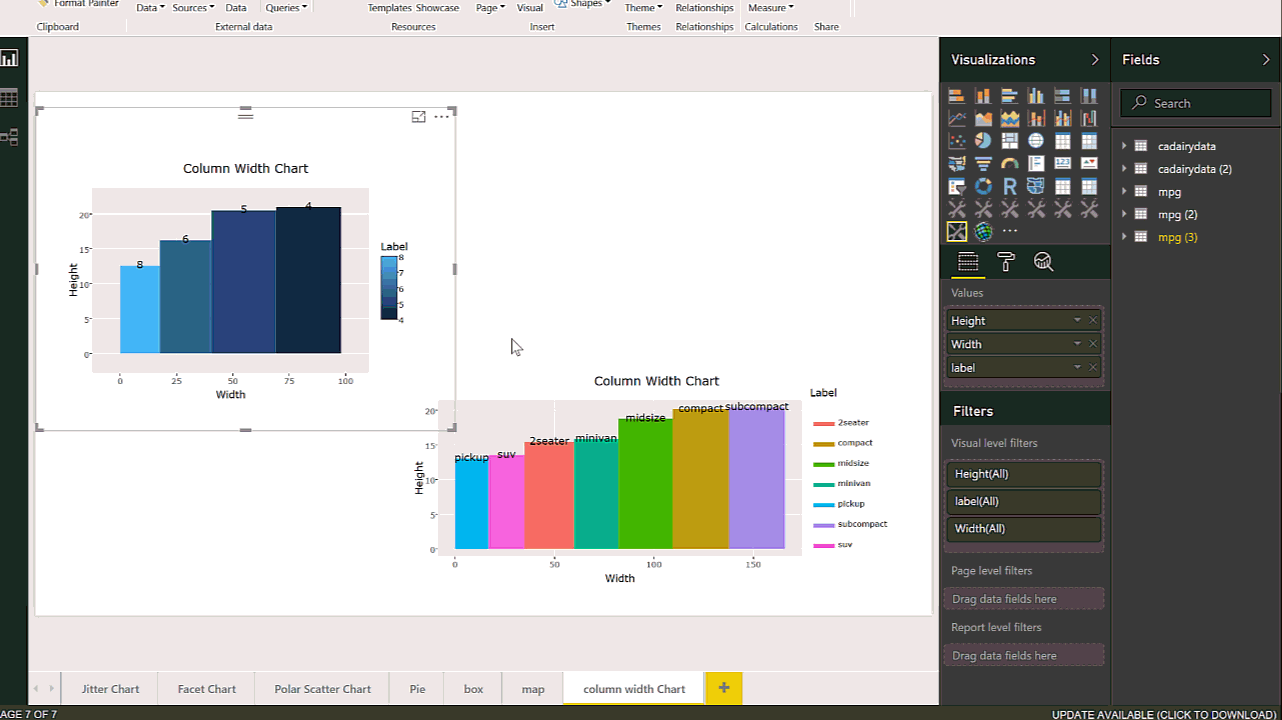
Interactive Charts using R and Power BI: Create Custom Visual Part 3
In the last two posts (Part 1 and 2), I have explained the main process of creating the R custom Visual Packages in Power BI. there are some parts that still need improvement which I will do in next posts. In this post, I am going to show different R charts that can be used Read more about Interactive Charts using R and Power BI: Create Custom Visual Part 3[…]