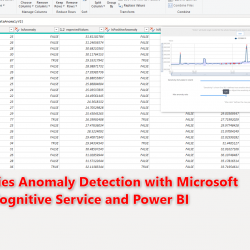
Time Series Anomaly Detection in Power BI using Cognitive Service and Power Query
I am excited about this blog post, this is based on the New service in Cognitive Service name “Anomaly Detection” which is now in Preview. I recorded a video about how it works in cognitive service https://youtu.be/7ZOtZDbn6gM. However, I am going to talk about how to use it in Power BI. In this post first, a Read more about Time Series Anomaly Detection in Power BI using Cognitive Service and Power Query[…]