
In this post, I want to explain the ARIM model (Autoregressive Integrated Moving Average).
Exponential smoothing could not consider the relationship between the values in the different time span. while ARIMA able to handle these data.
ARIMA Model needs three variables.
ARIMA(p,d,q)
First, let start with explanation of d value
what is d?
The first step in using ARIMA is to create a stationary time series data. so what is stationary time series?
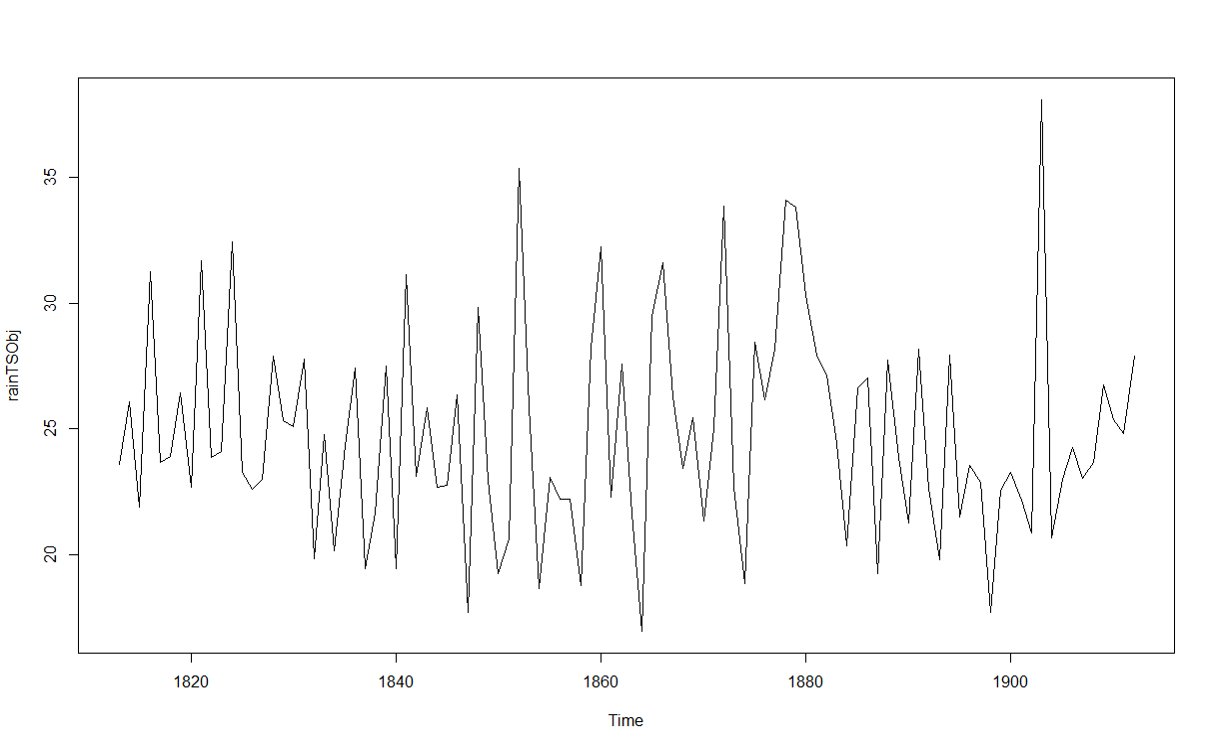
Stationary time series values fluctuate around one value during the time. for instance, the annual rainfall can be as an example of stationary time series. you could not see any trend in below chart and it fluctuates around value 25. if I calculate the variance of data during the period, it would be zero.
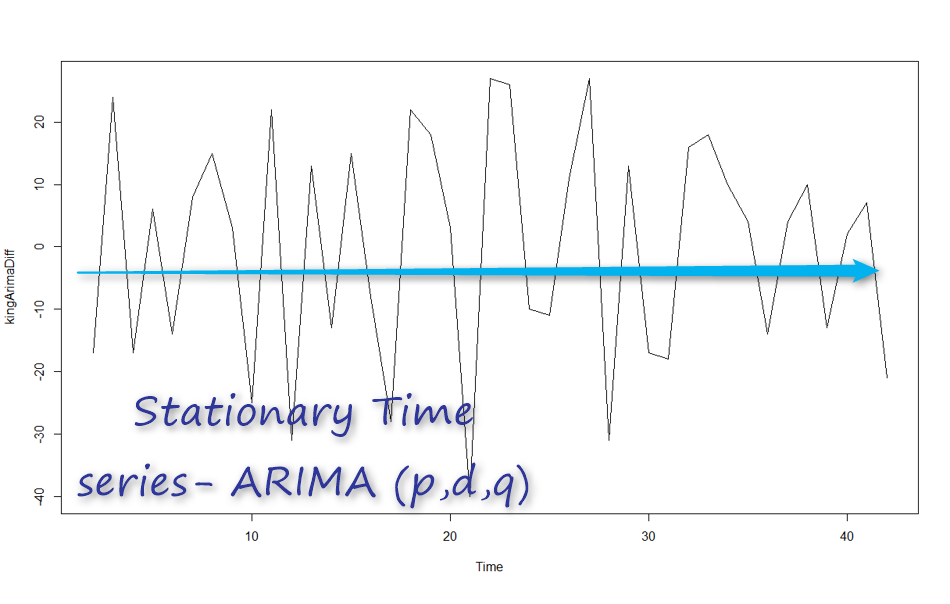
for Arima, we should have a stationary time series like below one. for below chart, the “d” value would be 0 as we do not need to do something about making it stationary.
Now, look at the below time series, it is not a stationary time series. In other words: Yt is not the same as Yt-1. Hence, we need do differentiate data more
so we will have Yt=Yt-Yt-1 so if for each t time we have this formula then d=1. if not maybe we need go further that means Yt=(Yt-Yt-1)-(Yt-1-Yt-2)=Yt-2Yt-1+Yt-2 then d=2.
t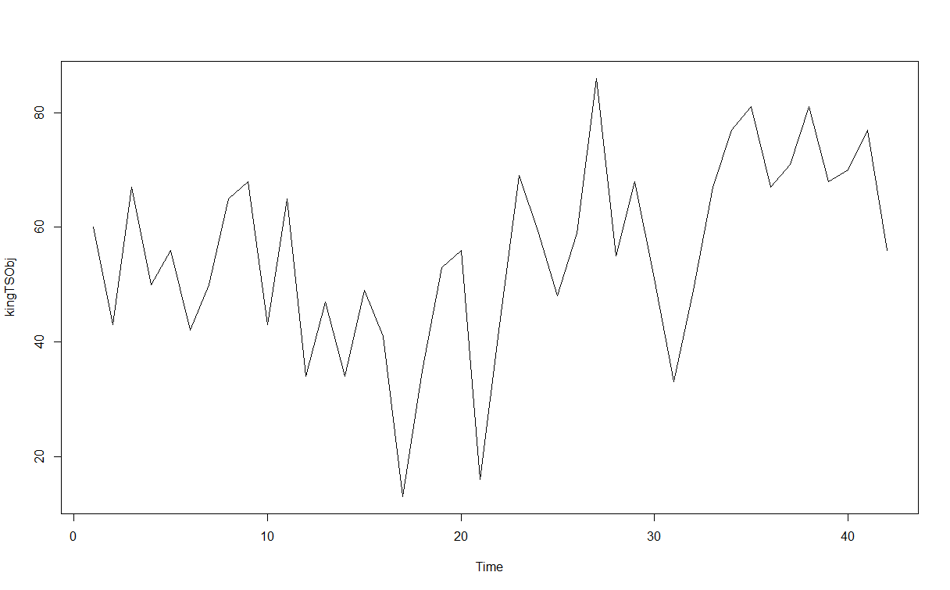
to do this, we have a function that helps named: “diff” . This function gets a time series object plus the number of differentiation. for above example, we do it for d=1
kingArimaDiff<-diff(kingTSObj,kingTSObj=1)
plot.ts(kingArimaDiff)
so the chart will be as
So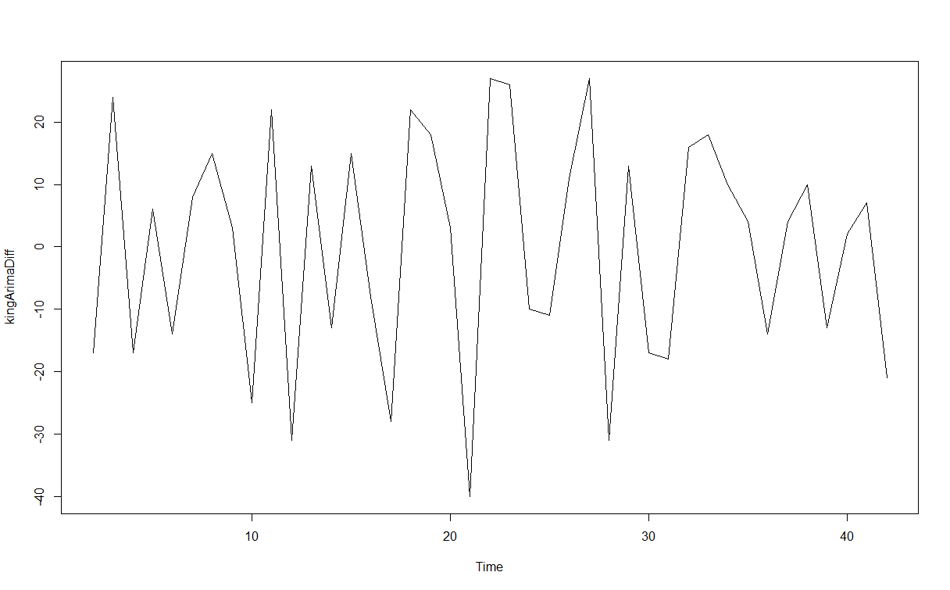
for identify the d parameters, we have to
1- plot the Time series object first
2- if not stationary, then we have to differentiate it to reach a stationary one.
in next post, I will explain the value of p and q which is related to acf and pacf chart.
http://a-little-book-of-r-for-time-series.readthedocs.io/en/latest/src/timeseries.html


