
In the last post, I have explained the d value for model ARIMA (p,d,q).
In this post, I am going to show how to identify the p and q values as below.
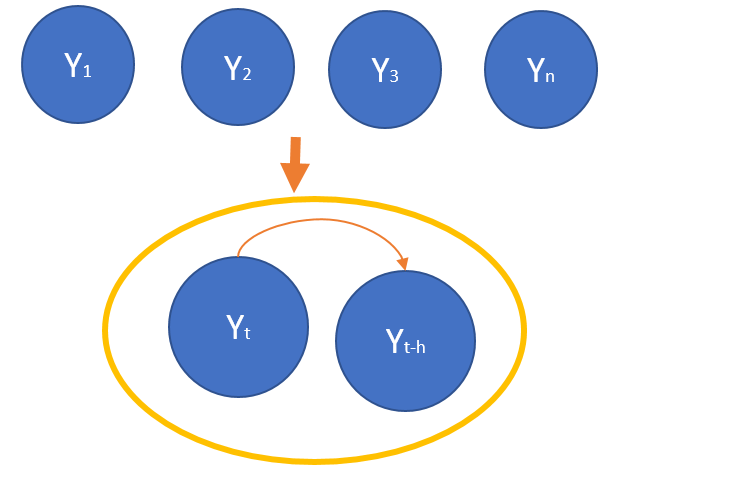
one of the main difference between exponential smoothing and Arima is that Arima considers the correlation of a value at a time with other values which we call autocorrelation.
to see this autocorrelation we need two charts:acf and pacf. but what they are and how they are related to p and q value
acf value or q
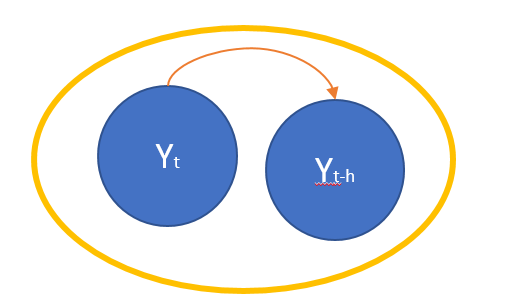
acf or (Autocorrelation chart). tries to find a correlation between a value and it successive. there may be a correlation between the value in time t and time t-1. however, these the value in time t may be also related to time 1,2 or any other time.
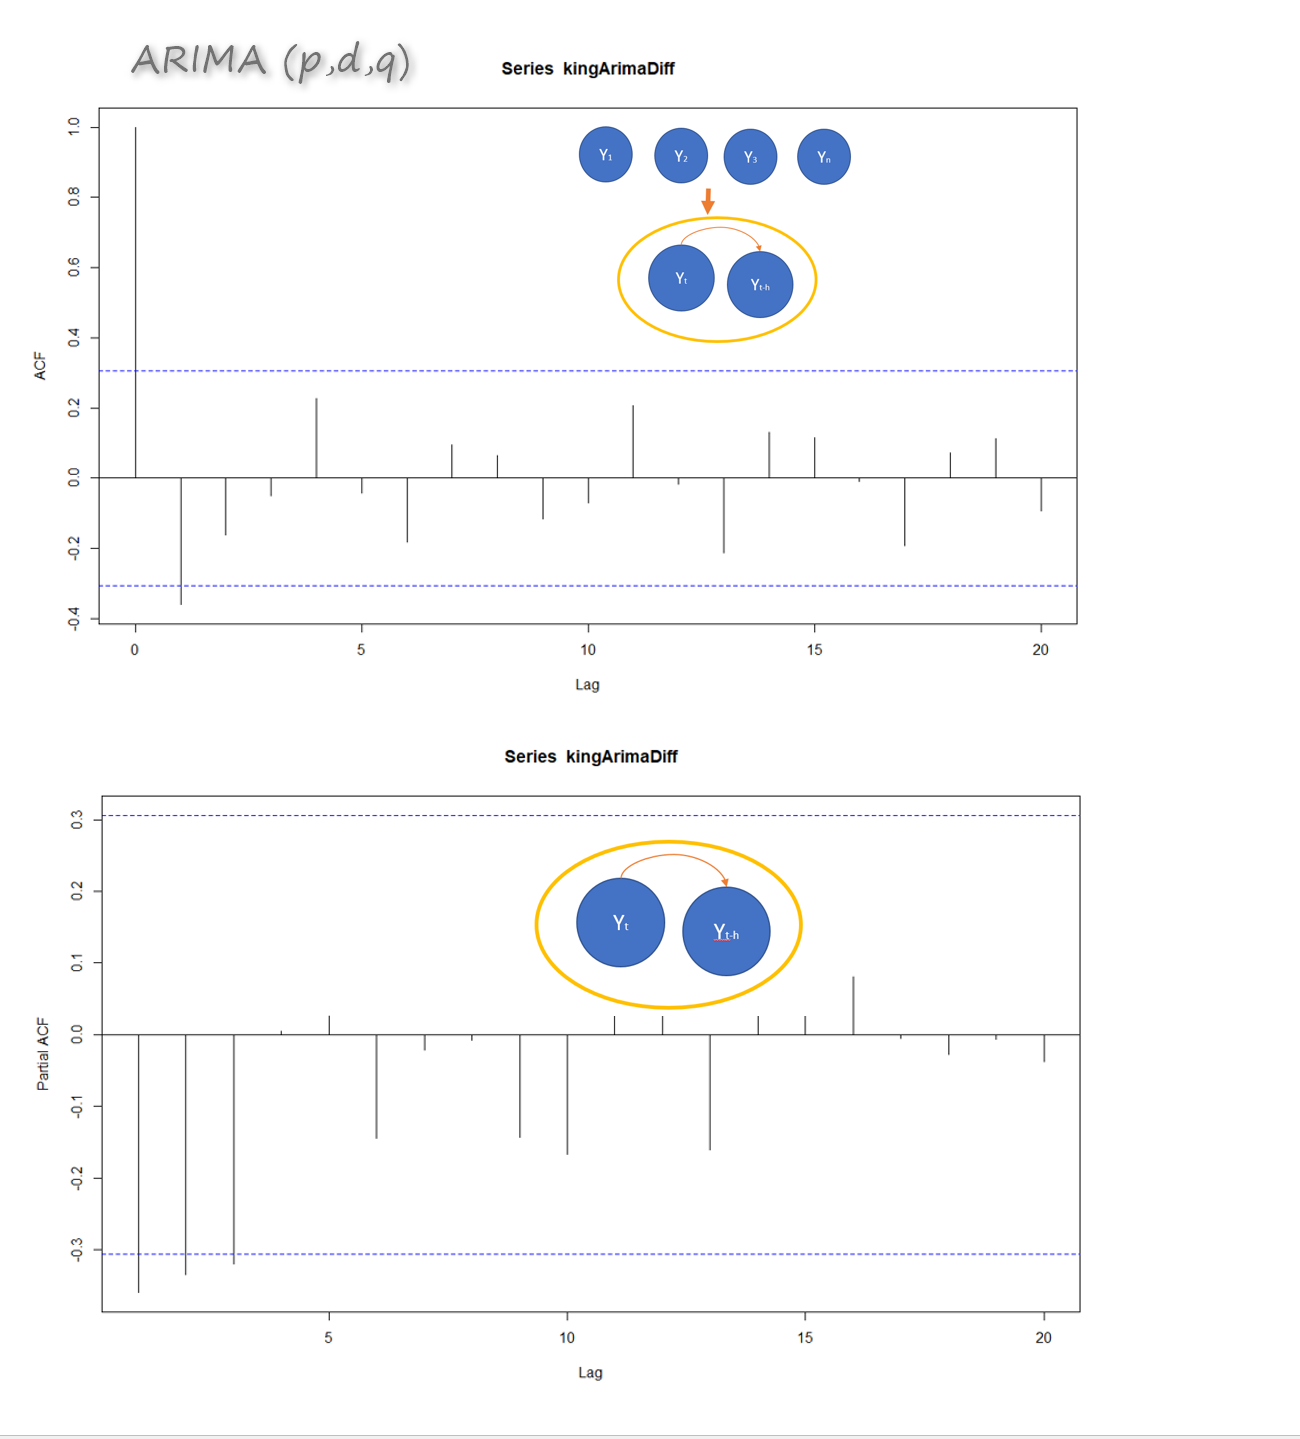
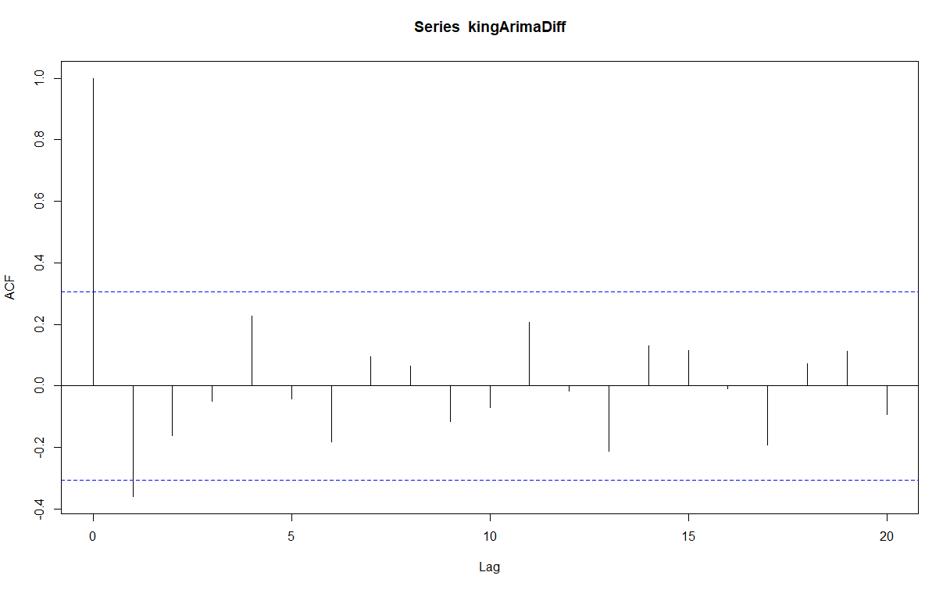
I create a plot for acf and for kings death age.
acf(kingArimaDiff,lag.max = 20)
what we have is below chart, this chart shows how the value in a different time from 1 to 20 is correlated to current time values. for instance for current time the correlation is 1 with itself. in time 2 it is a bit high and we can say there is a correlation between values in time 1 and time 2., however, we could not see any other correlation after time 2. so the value for q will be 1 as, after time one, we have no correlation.
pacf Value or p
now, we are going to see what is pacf value. pacf is partial autocorrelation values, that means we just purely consider the autocorrelation between time t and time t-1 with removing other correlation with t1,t2 or any other time, we just consider the correlation between time 1 and time 2.
now, we are going to see this partial correlation
pacf(kingArimaDiff,lag.max = 20)

above picture shows there is a correlation between time 1 and time 2 and 3 after time 3 there is no correlation. so p=3.
in other words we able to model our ARIMA model as
ARIMA(p=3,d=1,q=1) however, we able to choose we also below models
ARIMA(p=3,d=1,q=0)
ARIMA(p=0,d=1,q=1)
there is a rule that we better to choose a model with lower value so the final ARIMA model would be :ARIMA(0,1,1)
The above times series does not have any seasonality. in the next post, I will show you how to create an ARIMA model that support seasonality. Then I will explain how to forecast data.
http://a-little-book-of-r-for-time-series.readthedocs.io/en/latest/src/timeseries.html


