
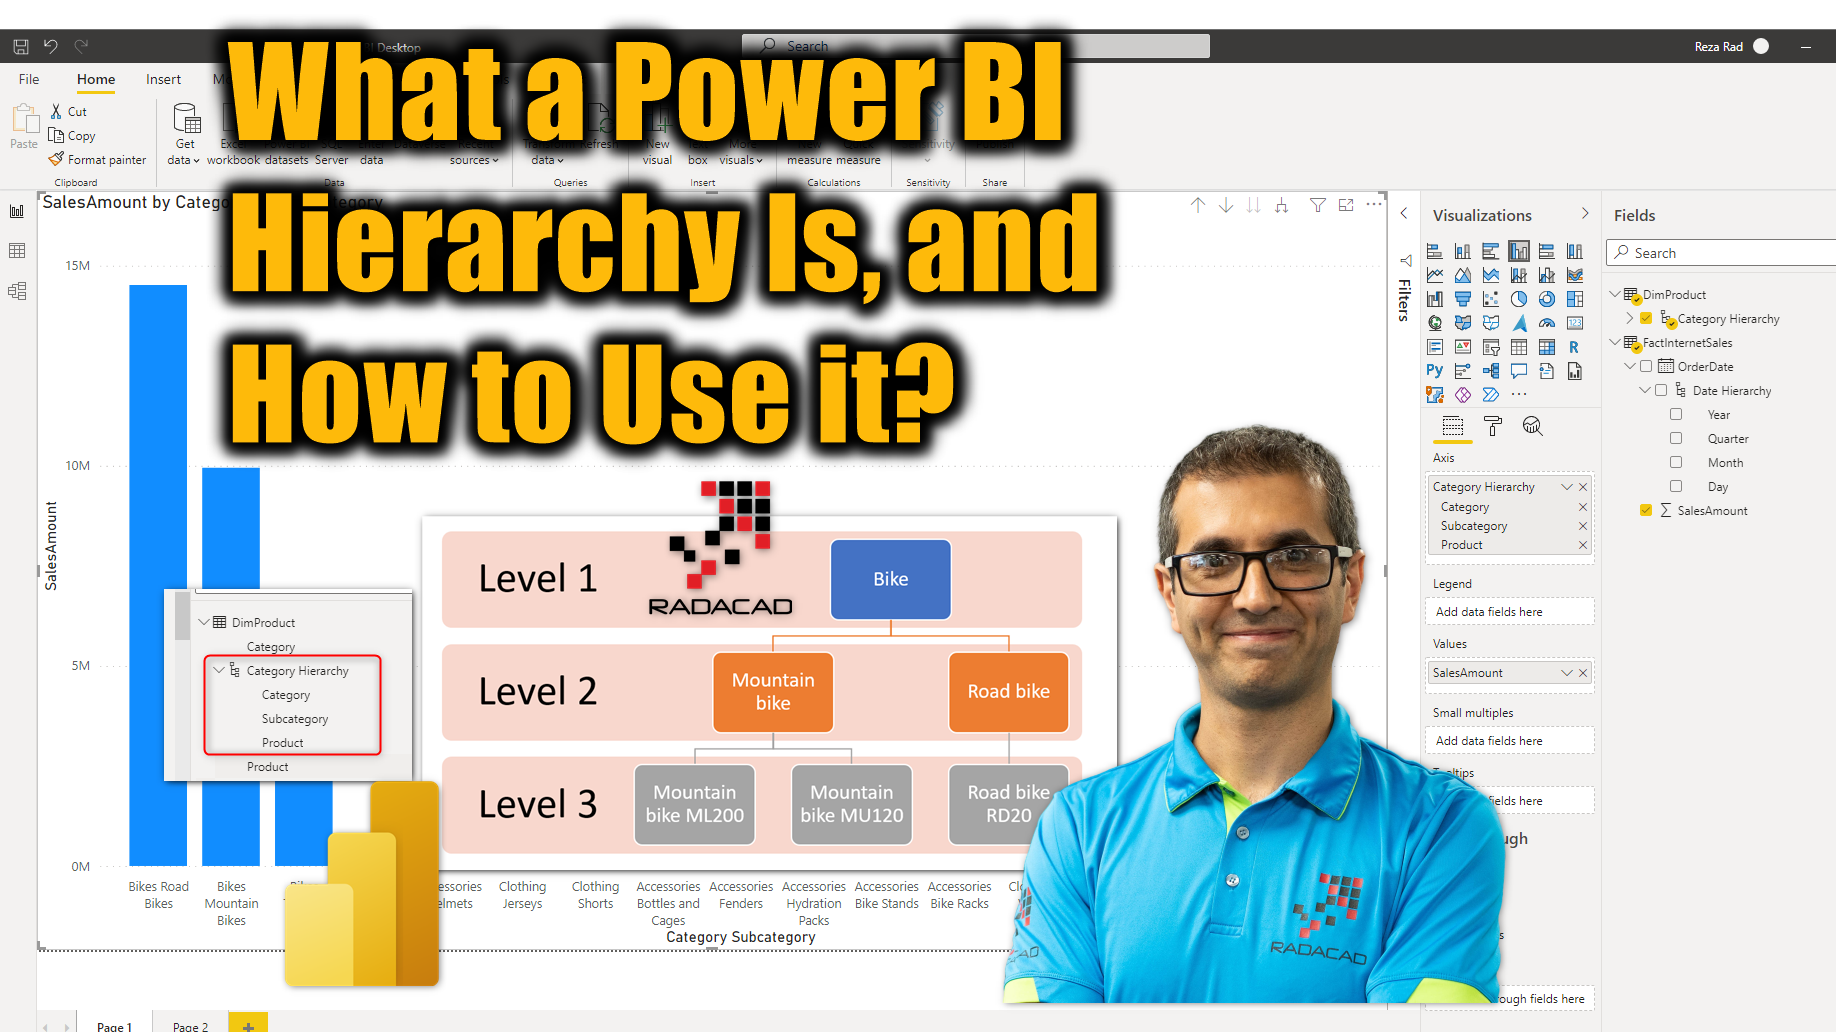
Power BI hierarchies are a useful structure for drill-down and data exploration in reports. A hierarchy can be created simply and can add great value for you as a developer and end-users for better data analysis. In this article and video, I’ll explain what a Power BI hierarchy is and how to create it.
Video
What is a hierarchy in Power BI?
A hierarchy is a set of fields categorized in a hierarchical way that one level is the parent of another level. Values of the parent level can be drilled down to the lower level. An example of a hierarchy is a category, subcategory, and product;
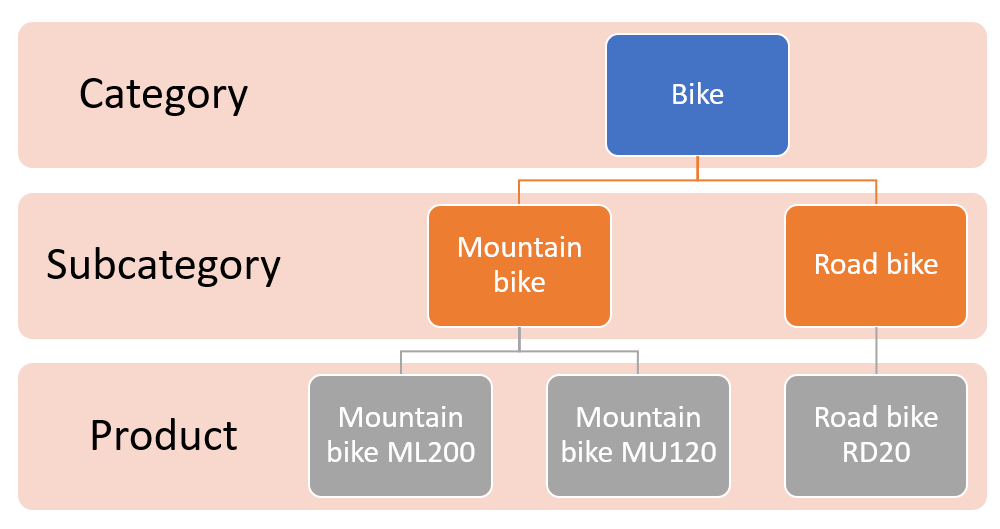
In the above hierarchy, the Bike is a category, which subdivides into two subcategories of Mountain bike and Road bike, and each of those has subdivisions into products. The levels of hierarchy will be as below;
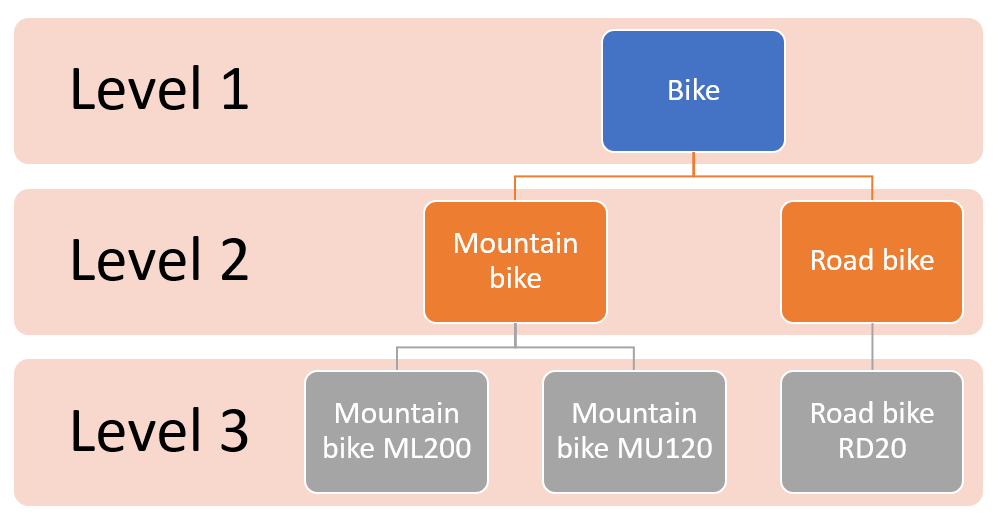
There is no limit on the number of levels. a Hierarchy can be 1 level or more than ten levels. Although, we usually won’t create a hierarchy just for one level. It is common to use it when we have two levels at least.
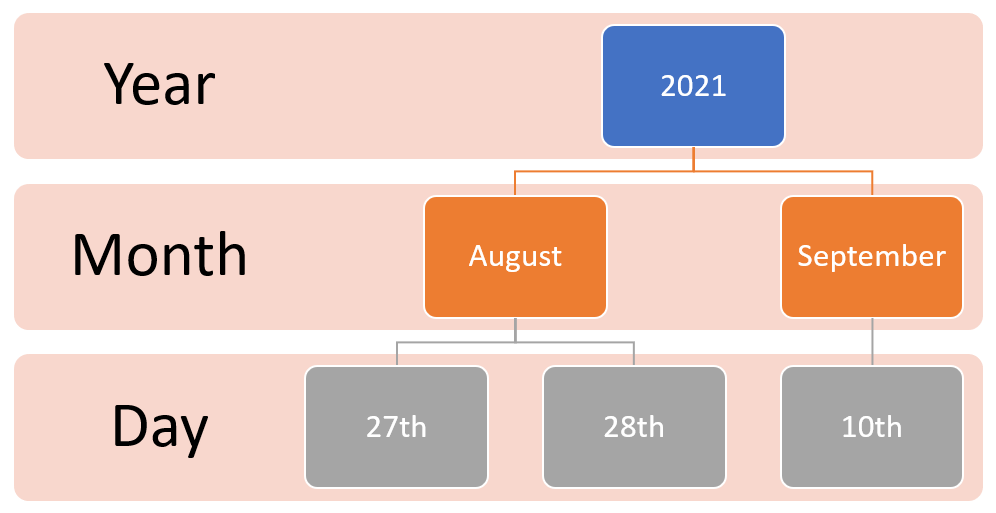
Another example of a hierarchy is a calendar hierarchy as below;
What is the use of a hierarchy?
Hierarchy can be used for data exploration. With a structure like the above hierarchies, you can easily drill down or up from a level to another level. I have explained in this article how the drill-down and up can be done on a hierarchy;
How to create the Hierarchy in Power BI?
Now that you know what the hierarchy is let’s see how you can create one.
I have a sample dataset including a product table with the columns below;
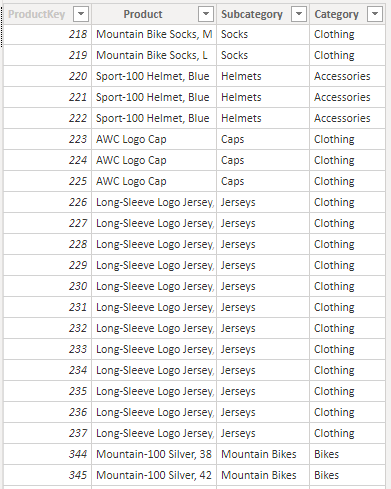
I want to create a hierarchy in a way that I have Category as level one, and then Subcategory level 2, and Product as level 3.
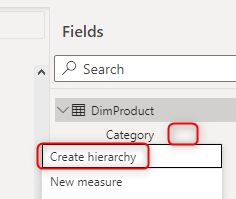
Right-click on the field you want to set as level 1 of the hierarchy in the fields list, and then select Create Hierarchy.
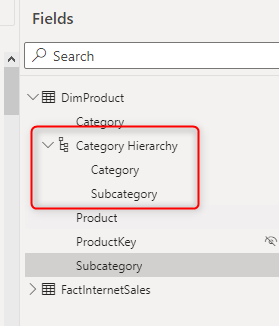
After that, you will see a new hierarchy created named your field name “Category” plus the word “Hierarchy”. This would have a hierarchy icon beside it and also an option to expand to the fields of the hierarchy. If you expand, you will see a copy of the Category field in there too.
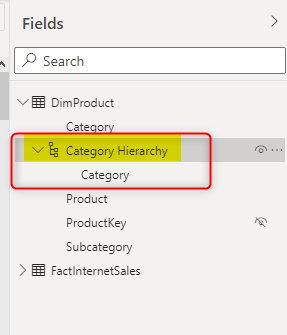
Note that the category field inside the hierarchy is just a reference to the original category column. It is not a new column or duplicate.
Now to add another level to the hierarchy, you can either simply just drag subcategory to the Category Hierarchy header or right-click on the subcategory and use Add to hierarchy.
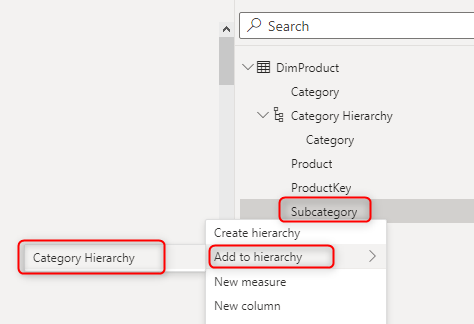
This adds that field as the second level of the hierarchy;
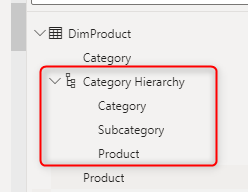
This is how simple you can create a hierarchy. If you continue it one more time for the Product, you’ll have that as a third level of the hierarchy;
If you want to rename the hierarchy, you can do it by renaming the Category Hierarchy itself. If you want to change the order of levels, you can drag and drop them over each other. Now that you know how to create a hierarchy, let’s see how it can be used.
How to use a hierarchy?
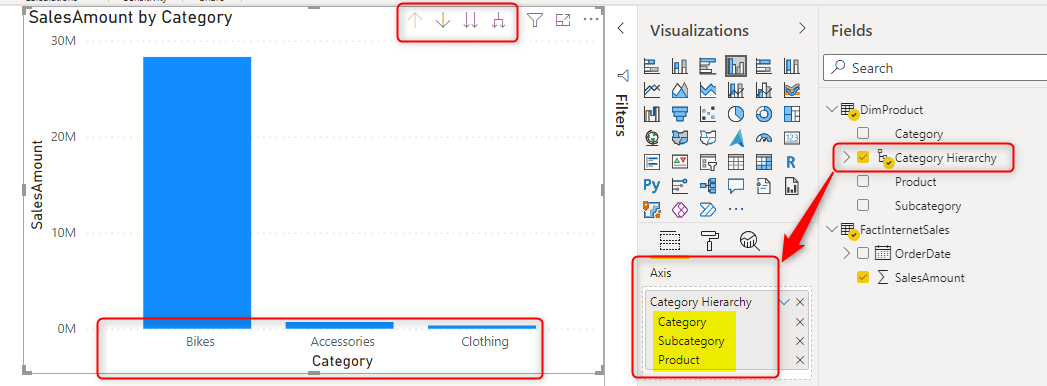
In the visualization tab of Power BI, you can simply drag and drop the who hierarchy by adding the header into an axis of a chart and see all fields of the hierarchy added there;
You can then
Hierarchy can be used for data exploration. With a structure like the above hierarchies, you can easily drill down or up from a level to another level. here is an example of drill down visualization;

I have explained in this article how the drill-down and up can be done on a hierarchy;
What if no hierarchy?
The hierarchy of fields can be created in a visual itself as well, and that is by adding fields one by one to the Axis like below;
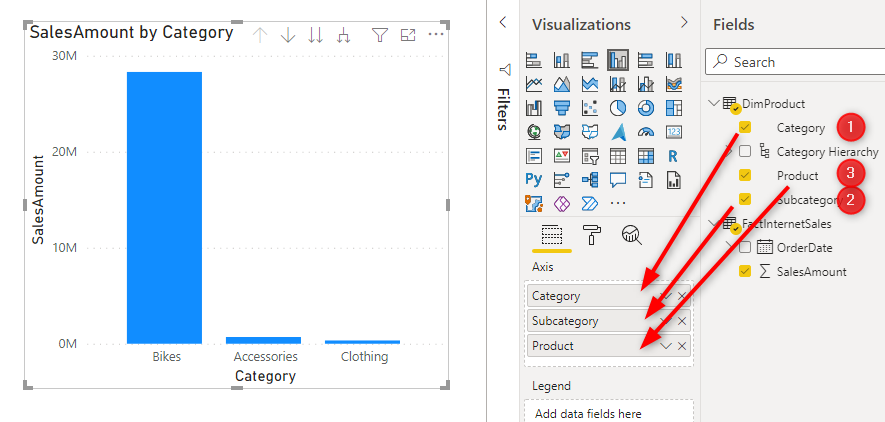
The above would give you the same result of drill/down functions in the visual. In fact, it looks like that you created a hierarchy from the visual point of view. You have to remember to follow the right order of columns when adding to the axis of the visual however. What you see here is what I call as the visual hierarchy; a hierarchy created just for a visual, rather than in the model.
Model hierarchy or Visual hierarchy?
As you have seen, you can create a hierarchy in a visual by draging and dropping columns into the Axis, let’s call it visual hierarchy. You can also create a model hierarchy, which means a hierarchy that can be used across the entire model. That is the method explained earlier in this article.
The model hierarchy can be used in multiple visuals
When you create the hierarchy in the model, you can use it in as many as visuals you want, and they will be all consistent. If you create a visual hierarchy, you have to repeat the steps of creating it for every visual and it is very likely you miss a level or add it in the wrong order. So this means you will have a better report with a model hierarchy.
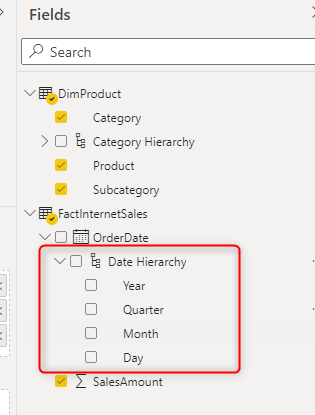
Default Date hierarchy
Power BI uses a default date table, and if you use it, all the date fields looks like a hierarchy of Year, Quarter, Month and Day. You can, of course, create any other hierarchies you like but for that I suggest using a custom date table.
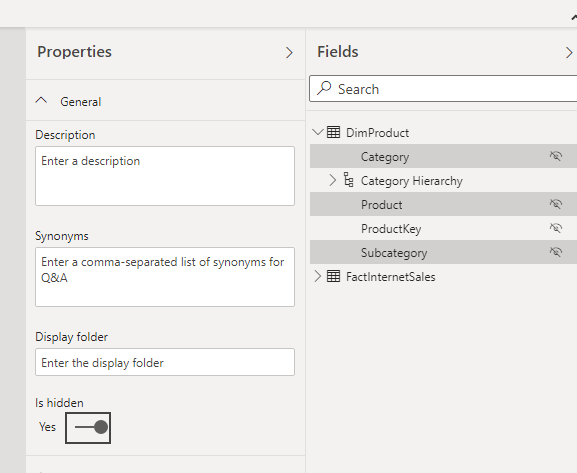
Hide original columns
A best practice when creating hierarchies is to hide the original columns. This would avoid the confusion for the report users when they see two different version of the Category field. one under the Category Hierarchy and one stand alone. You can hide the columns by simply right click and hide in reports. Or hide them all at once using the model tab.
Read this article to learn more about what other fields are good candidates to be hidden.
Summary
A hierarchy in Power BI can give you a consistent data exploration and drill down experience across your reports. Creating a hierarchy and maintaining it is simple, but it makes your Power BI report visualization better.


Reza is author of more than 14 books on Microsoft Business Intelligence, most of these books are published under Power BI category. Among these are books such as Power BI DAX Simplified, Pro Power BI Architecture, Power BI from Rookie to Rock Star, Power Query books series, Row-Level Security in Power BI and etc.
He is an International Speaker in Microsoft Ignite, Microsoft Business Applications Summit, Data Insight Summit, PASS Summit, SQL Saturday and SQL user groups. And He is a Microsoft Certified Trainer.
Reza’s passion is to help you find the best data solution, he is Data enthusiast.
His articles on different aspects of technologies, especially on MS BI, can be found on his blog: https://radacad.com/blog.
Thanks Reza,
I don’t see option to move member up/ down in the hierarchy. Using Report server. Any ideas?
Thanks, -w
Hi Winston
Good point
I just checked it and it seems I cannot drag and drop levels before and after each other too. I’m sure this was possible in prior versions of Power BI Desktop. maybe it is a bug at the moment and will be fixed in the next versions
Cheers
Reza
Hello Reza, very interesting, thanks.
Does the creation of hierarchy in the model influence the performance of the report in any way?
Hierarchy won’t have any performance impact. because you achieve the same result with the same speed if the same combination of fields used in the visual. It would be more of a consistency standard than performance tuning.
Hi !
Is there a way we can filter only one of the columns in the hierarchy table that will not affect the other column>?
Columns of the hierarchy are coming from the same table. when you filter one of the columns, the entire table gets filtered. so as a result other columns’ data gets affected automatically.
This is very well explained and step by step. than you Reza.