
The Power BI 2021 Salary survey was popular enough to get some interesting results. In this post, I am sharing the result of that survey (which is filled by the public) as a Power BI report. The report gives you an overall idea of how much the minimum, maximum, and average salary should be based on geo-location information, and also some other factors such as skill level and experience. Let’s see where you can get a better salary in 2021?
Power BI 2021 Salary Survey
About a couple of weeks ago, I published a blog post about a survey and asked everyone to go and fill in their salary information there (No sensitive data have been asked). I am glad that many of you did answer that survey. In a couple of weeks, we had over 300 responses, which is great. The survey had some questions including but not limited to Location, Salary, experience in Power BI, the skill level on each Power BI component, and the type of company (consulting, or in-house). The survey is still open, and I encourage you (if you haven’t yet responded) to go and respond to it (To have a much more accurate analysis).

Here is also the form to fill in the survey
In that blog post, I also had a Power BI report which was using real-time streaming data pushed through Power Automate to the Power BI dataset. Because that was a streaming dataset, I did not have the full ability to use Power Query and some DAX for cleaning up the data and building more analysis on it. After two weeks, now with some data as an Excel source, I can use the full power of Power BI to do it. So here is the result:
Power BI report: Result of 2021 Salary Survey
Here is the repost I build on top of this data (all the data is coming from the survey, no we query or anything like that. This is all the data that you and others have filled in the form):
Some facts about the report
I thought better to answer some of the questions in advance because I believe these would be popular questions as soon as you see the report:
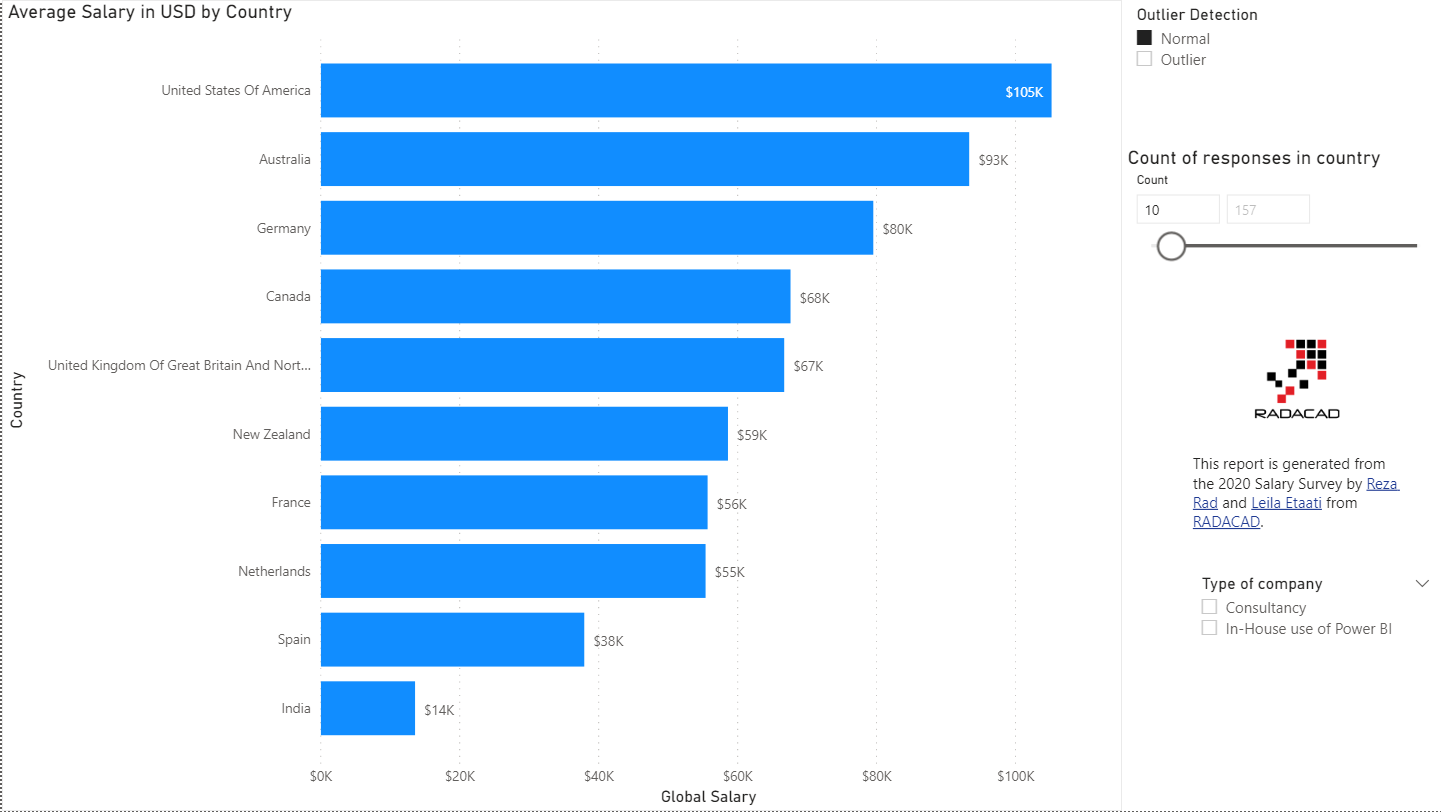
- On every page that you see salary values are compared between countries, a conversion of local currency to USD has been applied (using Xe.com) website rates. and rates are all converted to USD to have a unique and correct view of the salary globally.
- It would be great for sure to add the cost of living for each country to get more interesting results. However, I haven’t found a reliable source for that yet. I might add it later to the report.
- Bear in mind that salary is different city by city in each country. Here in New Zealand, we have different salaries in Wellington compare to Auckland, and I know this is also the fact in many other cities and countries. to get the analysis at the city level, we need more data points. Which unfortunately we don’t have it yet. I encourage you to send the link to the survey to everyone in the Power BI space you know and ask them to fill. If we have enough data, then I will add city-based analysis to the report too.
- The data in the report has been cleaned because there were some values that needed cleanup. many country values which needed matching, such as USA, United States, United Stats!, United States of America, America, U.S….
- There were some anomalies in the data, which been detected as an outlier (using the magic wand of Leila Etaati). For example, there have been salaries of over 700 million! Leila will write about the way we used to detect those outliers later.
- There are many countries in which we do not have enough data points for them. I believe if we do not have more than 10 data points, then the result is most probably inaccurate. Imagine that two people only enter salary from a country, one saying the salary is 20K, and the other one 200K. This is not enough data to analyze. If you don’t see your country there, then share the survey with others in your country and ask them to go and fill the survey.
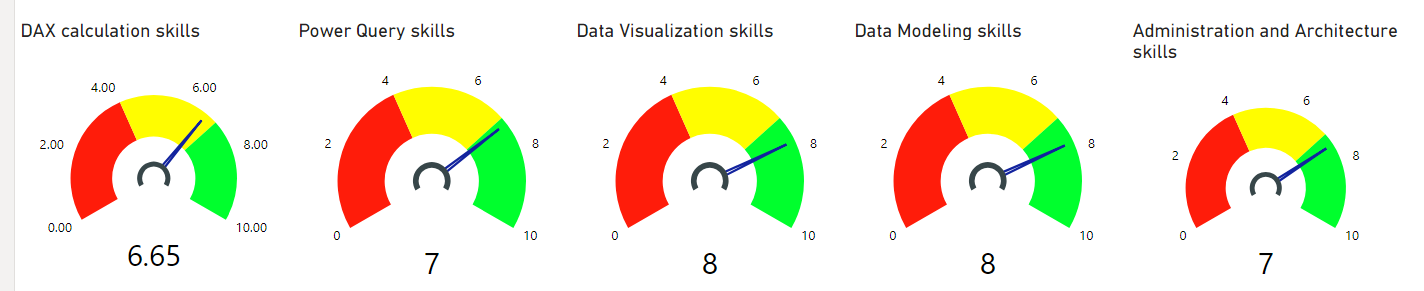
- Most of the responses that we got in the survey belong to people with high ratings in their skill levels of Power BI. This means the whole report is focused on those people with good knowledge and experience in Power BI. Please encourage everyone at any level of understanding of Power BI to go and fill the survey.
- We recommend you to filter data to have the count of responses in each country to be at least 10 and set the outlier detection slicer to Normal. This will help you to get more accurate results.
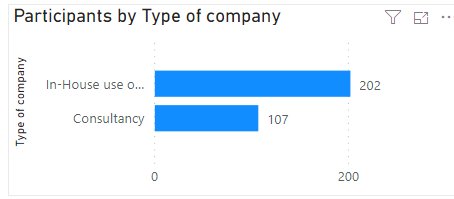
- We had more responses from people who use Power BI for the company’s in-house usage than consulting. So the report should be more accurate if you filter it for in-house Power BI usage.
Video


Reza is author of more than 14 books on Microsoft Business Intelligence, most of these books are published under Power BI category. Among these are books such as Power BI DAX Simplified, Pro Power BI Architecture, Power BI from Rookie to Rock Star, Power Query books series, Row-Level Security in Power BI and etc.
He is an International Speaker in Microsoft Ignite, Microsoft Business Applications Summit, Data Insight Summit, PASS Summit, SQL Saturday and SQL user groups. And He is a Microsoft Certified Trainer.
Reza’s passion is to help you find the best data solution, he is Data enthusiast.
His articles on different aspects of technologies, especially on MS BI, can be found on his blog: https://radacad.com/blog.
Report link not working
Thanks for letting me know. It is fixed now
Cheers
Reza