
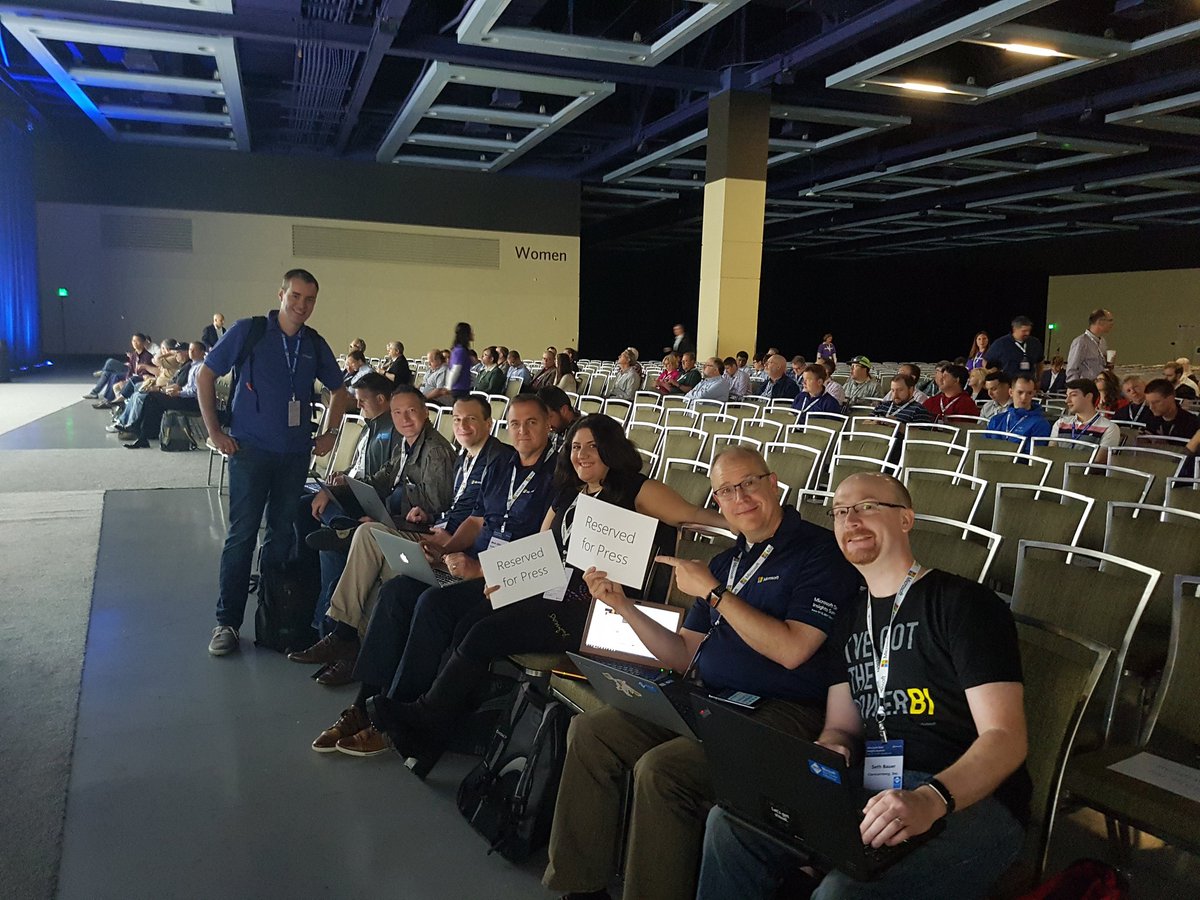
Hello from Keynote of Microsoft Data Insight Summit 2017. I’m sitting at the blogger table (there is no table actually, just chairs 😉 ) and will be blogging live from here new announcements and live events from the keynote. Watch this blog and refresh your page 🙂
7:51am: Sitting in press chair. people are filling chairs quickly. 2000+ attendees this year data insight summit. twice of the last year.
8:05am: People still joining in. the line in registration is long. so I believe keynote will start with a bit of delay.
8:07am: announcement: Keynote begins in 5 minutes!
8:14am: intro video started. yohooo.
8:16am: James Philips on stage now. Keynote started.
JP: Data Summit sold our 5 weeks ago.
8:17am: what you see today will be shipped in the next 3, 4 months maximum.
8:23am: there are many custom visuals developed for specific companies (not public)
8:27am: Power BI is available in every data center. worldwide reach.
8:31am: Power BI Premium is general available now.
8:33am: With Power BI Premium it is unrestricted to scale up and boost performance. (read more about premium from my blog post here).
8:35am: Siri PM of Power BI. demoing Power BI premium
8:37am: With Premium you can update data set up to 48 times a day
8:41am: Power BI premium: unlimited distribution with Apps, Performance, and frequent refresh.
8:43am: J.P: Power Apps and Power BI: Actionable BI.
8:45am: John Towsand on stage showing a custom visual with Power BI.
8:50am: John demoed a usage of Power App and Power BI together.
8:51am: Amir NetZ on stage
8:53am: Power BI Embedding in applications New generation avaiable (Reza: I will be demoing that tomorrow in my session in summit)
8:58am: Visio Diagram Visual in Power BI demoed.
9:00am: Power App visual in Power BI: Writeback
9:01am: Kim Manis demoing some new features in Power BI Desktop
9:03am: Data bars demoed in Power BI Desktop Table Visual. Formatting options too
9:05am: Import custom visuals directly from Power BI Desktop. Awesome feature
9:09am: Drillthrough pages; Filter across pages
9:12am: Bookmarks in Power BI Desktop. You can have history tracking of visualization
9:14am: Spotlight : popup in the story
9:17am: Buttons can be changed to links to navigate and filter
9:19am: What If parameters in Power BI Desktop
9:23am: Quick Insights inside Power BI Desktop. set of visualization to choose from. (Explain the Increase)
9:25am: Waterfall chart will be improved in Power BI Desktop very soon.
9:29am: Quick insight in Q&A for Mobile
9:30am: Keynote finished.


Reza is author of more than 14 books on Microsoft Business Intelligence, most of these books are published under Power BI category. Among these are books such as Power BI DAX Simplified, Pro Power BI Architecture, Power BI from Rookie to Rock Star, Power Query books series, Row-Level Security in Power BI and etc.
He is an International Speaker in Microsoft Ignite, Microsoft Business Applications Summit, Data Insight Summit, PASS Summit, SQL Saturday and SQL user groups. And He is a Microsoft Certified Trainer.
Reza’s passion is to help you find the best data solution, he is Data enthusiast.
His articles on different aspects of technologies, especially on MS BI, can be found on his blog: https://radacad.com/blog.