
Power BI is not a strange word these days, there are many blog posts, videos, news, and speakings about it. Power BI is Microsoft Cloud BI services that released recently. Power BI is not only Cloud BI but also it offers good self-service BI stack as well. Power BI has five main components which are:
- Power Query: For data extraction, transformation, and load into model.
- Power Pivot: Data Modelling tool.
- Power View: Data Visualization tool
- Power Map: 3D Geo-spatial data visualization tool.
- Power Q&A: Engine for natural language questions and answering
There are wide range of customers for Power BI;
- Small businesses who want to get benefit from a BI system, but they don’t want to pay for SQL Server licensing, and they want BI in affordable price
- Large enterprises who has many users connecting from mobile or tablet devices and would like to have mobile friendly BI front-end
- Business Analysts who can simply use Power BI as self-service tool to work with data and generate insight out of that
As you see above Power BI covers wide range of the market, and with the cheap price of this product/service, it is very likely that most of businesses use this extensively in the future. So understanding Power BI and being professional in that field is a great achievement for a Microsoft BI professional.
8-1- Power Query
First introduced with name of “Data Explorer” as an add-in for Excel. the name changed soon at early preview releases of this product to Power Query. Power Query nowadays is still an add-in for Excel that you can simply download for free and use it with Office 2013 Pro Plus. Power Query will be available as part of Excel 2016 default setup. Power Query is the engine that can extract data from different sources, transform the data, and load it into Excel spreadsheet or into a Power Pivot data model. Power Query has a very easy and user-friendly graphical user interface which is understandable for even business analysts.

Power Query works with a code behind language called “M”. “M” is a functional language which is much more powerful than it seems in the Power Query GUI. This statement means there are some functionality in M that are not available through GUI. If you want to be professional and expert in Power Query, then you have to learn M very well. There are some good resources for Power Query, even some from my own blog which I invite you to have a read through.
Blog Post: Tutorial Introduction to Power Query
Blog Post: Power Query Formula Language: M
Blog Post: Power Query Formula Language: Table Functions Part 1
Blog Post: How to Get List of All Functions and Invoke Them in Power Query
Blob Post: Writing Custom Function in Power Query M
Blog Post: Script to Generate Date Dimension with Power Query M – With Financial Columns
Blog Post: Date Dimension in Power Query – Public Holidays Fetched Live
Links above gives you basic understanding of Power Query, follow them one by one and you will lean the power query basics through that.
Chris has wonderful blog posts about Power Query.
Video Recorded Session: PASS Summit 2014: Top 5 Power Query Functionality that you Don’t Know
This session highlights features of M language that are not available in Power Query GUI.
Book: Power Query for Power BI and Excel by Chris Webb

This is the very first book published for Power Query, Chris is wold well-known expert in this field. Despite the fact that Power Query updates almost every month, this book still gives you great understanding of Power Query.
MSDN PDF: Power Query Formula Language Specification
This PDF gives you better understanding of structure of M language, how to create variables, write conditional statements and everything related to language structure.
MSDN PDF: Power Query Formula Library Specification
Power Query has lots of functions. This 281 pages PDF gives good explanations on functions with some examples of them. there is also an html online version of this library here:
MSDN URL: Power Query Formula Library
8-2- Power Pivot
This component is the oldest component of Power BI, it has been released at 2010 as an add-in for Excel 2010, and in Office 2013 it is embedded. Power Pivot is modelling engine of Power BI. Power Pivot works with xVelocity In-Memory engine same as SQL Server Analysis Service Tabular. There are however some differences between SSAS Tabular and Power Pivot which makes Power Pivot more kind of a team BI or self-service BI versus SSAS Tabular which is of type corporate BI.

Power Pivot works with an expression language called Data Analysis eXpression “DAX”. DAX in the first glance is very similar to excel functions, but it is different somehow. The key to be expert in Power Pivot is to learn DAX well. There are fortunately good resources for both Power Pivot and DAX. I just mention couple of books here for you as starting point.
Book: Microsoft Excel 2013: Building Data Models with PowerPivot


8-3- Power View
I did the explanation of Power View and Power Map in previous part (Data Visualization). However I add them here again for completeness of the post.
Power View is a highly interactive dashboard and visualization tool which is part of Power BI tool nowadays. This tool doesn’t have a long history, it first appeared in SQL Server 2012 and SharePoint Enterprise 2010, and then it embedded in Excel 2013 for local use. This tool work with both SSAS tabular and multi-dimensional. the Power BI version of this tool works with HTML5 and is mobile friendly. If you want to have a feeling of charts and dashboards created with this tool, have a look at FIFA Worldcup 2014 data analysis post which is all based on Power View visualizations.

As this technology hasn’t been so long in the market, there are not so much books for it. However below book is a good book for Power View, Power View changed a few after publishing this book, but those changes can be picked easily with playing with the product.
Book: Visualizing Data with Microsoft Power View

8-4- Power Map
Power Map is one of the newest data visualization tools of Microsoft which is part of Power BI and works as an add-in for Excel. Power Map is 3D Geo-spatial data visualization tool. You can create animations and stories and export it into videos with this tool.

The tool is not a complex tool, you can start playing with it with a very simple process. There are not that much books in the market for this tool yet, but there are number of good videos for using this tool with great examples on MSDN website. Actually the tool is simple and easy enough that won’t require a book at this stage. I recommend reading MSDN Power Map links at this stage;
MSDN: Power Map How to Do posts:
- Introduction to Power Map
- Explore your data in a Power Map tour
- Geocode your Power Map data
- Move around in Power Map
- Visualize your data in Power Map
- Change the look of your Power Map
- Create a custom map in Power Map
- Add or move a scene in a Power Map tour
- Filter data in a Power Map tour
- Change Power Map time options
- Export a Power Map tour as a video
8-5- Power Q&A
This component of Power BI enables users to ask questions from the Power Pivot model with their natural language, and get a response with some visualization on Power View. This great feature works only with Power BI and there is no off-line version of it.

There are not that much big references for this technology, but there are some good MSDN links about tips and tricks of designing Power Pivot data model so Power Q&A works best in such model.
MSDN Blog Post: Demystifying Power BI Q&A Part 1
MSDN Blog Post: Demystifying Power BI Q&A Part 2
MSDN Blob Post: Demystifying Power BI Q&A Part 3
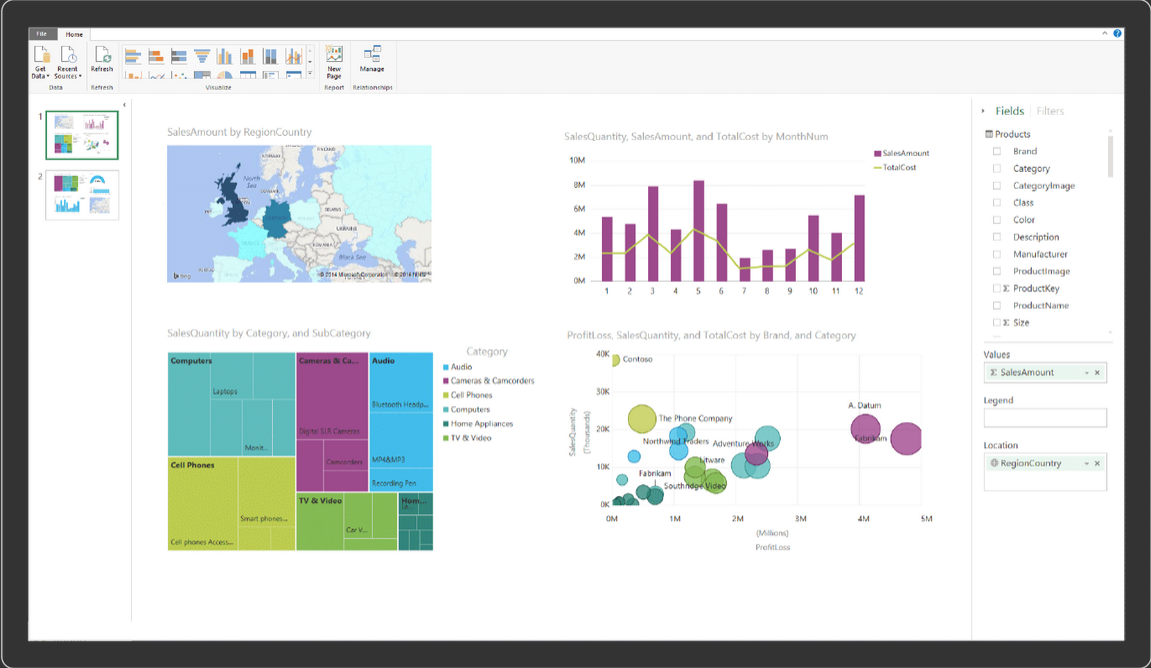
8-6- Power BI Desktop
Power BI Desktop is the latest addition to Power BI stack. This is the Development editor for Power BI, this development editor will create solutions based on three components: Power Query, Power Pivot, and Power View. the Designer works in a way that it be as user friendly as possible. The intention is that everyone even senior manager be able to work directly with this tool. We will see how Microsoft Succeed with this goal, however this tool is a great tool even for developers because it has three main components in it. and creating BI solutions with this tool is far easier and more integrated.

I strongly recommend you to read Power BI online book; from Rookie to Rock Star for learning this tool.
online free book: Power BI online book; from Rookie to Rock Star
Related Posts:
Walk-through Steps: I’m New to BI, Where to Start? – Part 0: Prerequisites
Walk-through Steps: I’m New to BI, Where to Start? – Part 1: Fundamentals, Data Warehouse and ETL
Walk-through Steps: I’m New to BI, Where to Start? – Part 2: Modelling with BISM
Walk-through Steps: I’m New to BI, Where to Start? – Part 3: Data Governance
Walk-through Steps: I’m New to BI, Where to Start? – Part 4: Data Visualization
Walk-through Steps: I’m New to BI, Where to Start? – Part 5: Power BI
Walk-through Steps: I’m New to BI, Where to Start? – Part 6: Data Mining
Walk-through Steps: I’m New to BI, Where to Start? – Part 7: Azure


Reza is author of more than 14 books on Microsoft Business Intelligence, most of these books are published under Power BI category. Among these are books such as Power BI DAX Simplified, Pro Power BI Architecture, Power BI from Rookie to Rock Star, Power Query books series, Row-Level Security in Power BI and etc.
He is an International Speaker in Microsoft Ignite, Microsoft Business Applications Summit, Data Insight Summit, PASS Summit, SQL Saturday and SQL user groups. And He is a Microsoft Certified Trainer.
Reza’s passion is to help you find the best data solution, he is Data enthusiast.
His articles on different aspects of technologies, especially on MS BI, can be found on his blog: https://radacad.com/blog.
2 thoughts on “Walk-through Steps: I’m New to BI, Where to Start? – Part 5: Power BI”