
There are multiple ways that you can add a RANK column to your table, You can do that dynamically inside the Power BI report using DAX Measures, or you can do it pre-calculated. If you are doing a pre-calculated rank (let’s say for an aggregated table or something like that), then it would be perhaps better to do it in Power Query as you can use that later on in other places. In this article and video, I’ll explain how to create a RANK column in Power Query.
Video
Why Rank in Power Query instead of DAX Measures?
The first question you have to ask yourself, whenever you want to calculate the rank is; “where should I create it?” Is this rank going to be a dynamic rank calculation based on the selection of some slicers in the report? for example, you may want to calculate the rank of customers based on the period of dates selected in the slicer (which can be changed by the report user). In a situation like that, I would recommend calculating rank as a DAX measure. This method will give you a dynamic output based on whatever the user has selected in the slicers and in the report. I have explained Rank calculation as a DAX measure in these two articles;
- Showing Ranking in a Visual in Power BI using the RANKX DAX function
- DAX and Conditional Formatting Better Together: Find The Biggest and Smallest Numbers in the Column

Although, calculating rank dynamically is often useful, It is not rare to need to do ranking on a pre-calculated basis. Let’s say, for example, you want to create an aggregated table by customers and year. and you want to rank customers based on their sales amount in that table. the period and other factors are remaining static. This pre-calculated aggregated table can speed up the performance of your report significantly in the future. In a case like this, the rank calculation can be done as a pre-calculation. And when you do this as a pre-calculation, Power Query is a useful option. Because then you can do that even in a Dataflow, and the result can be used in multiple Power BI datasets.
Use Power Query Ranking if you want the rank calculation to be pre-calculated. As an example; this method can be used for improving the performance of a report when using aggregated tables.
Sample table
The sample data table I use for this example is as below;
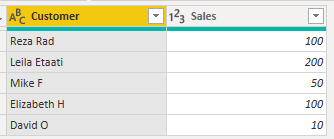
Table.AddRankColumn in Power Query
Adding the rank column in Power Query is not (yet) added to the graphical interface of Power Query Editor. This means until then, you should use the function itself. The function is called Table.AddRankColumn. It is a simple function to use, with four parameters, and one of the parameters is optional. Here is how Table.AddRankColumn function works;
Table.AddRankColumn(
<table>,
<new column name>,
<comparison criteria>,
[<options>}
)
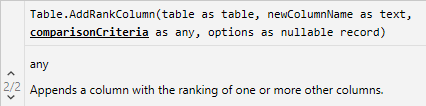
The parameters are explained below:
- table: the name of the table that the rank column will be added to it.
- new column name: the title/name of the rank column
- comparison criteria: the conditions that determine the way ranking should be calculated. for example based on the descending order of the SalesAmount column.
- options: this is an optional parameter for choosing the RankKind. There are three types of ranks; Competition, Dense, and Ordinal. The default is Competition.
Let’s see examples of this now.
Adding Rank Column to a table in Power Query Editor
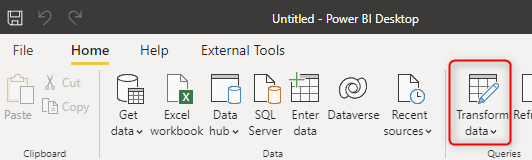
The method explained in this article is using Power Query, So you need to be in Power Query Editor. You can get to the Power Query Editor using the Transform Data option from the Power BI Desktop;
In the Applied Steps, right-click on the last step and select Insert Step After;
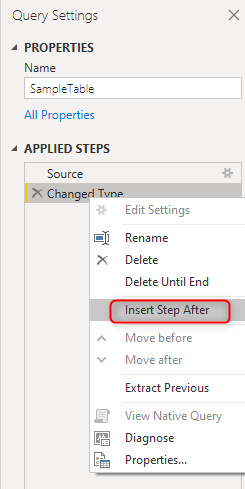
This will create a new step with no transformation. Now you can use the Formula bar to apply whatever transformation you want.
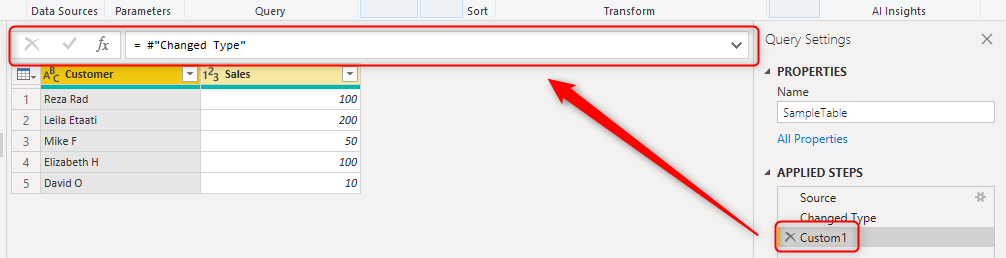
The #”Changed Type” in the above formula is the name of the table coming from the previous step. This is the name of the table that I can pass as the first parameter of the Table.AddRankColumn. So the Formula can be like below;
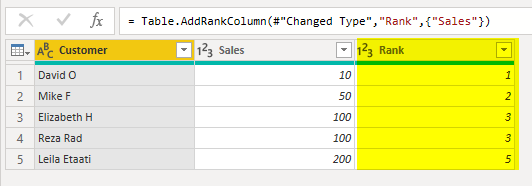
= Table.AddRankColumn(#"Changed Type","Rank",{"Sales"})
You will need at least three parameters to use the Table.AddRankColumn function, the table name (which comes from the previous step), the new column name “Rank”, and the columns and conditions on which the ranking will be calculated based on that. In this example, we just said “Sales” column for ranking, with no order specified, which means the ascending order of values by default. the output will be as below;
Ranking Condition
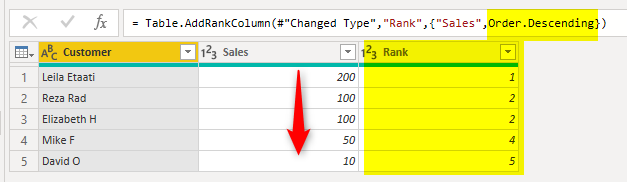
You can change the order by adding the condition still in the third parameter of the function. using Order.Descending.
= Table.AddRankColumn(#"Changed Type","Rank",{"Sales",Order.Descending})
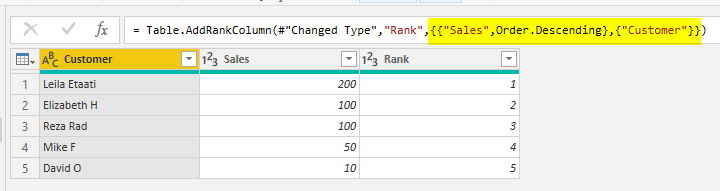
The column name and the order of that are added in a list structure, that is why it is enclosed inside { and }. You can do the ranking based on two columns like this:
= Table.AddRankColumn(#"Changed Type","Rank",{{"Sales",Order.Descending},{"Customer"}})
To learn about list structure in Power Query, read my article here.
Rank Kind
Another useful setting is the rank kind. There are three options to choose from: Ordinal, Competition, and Dense. These options are added as the fourth parameter to the Table.AddRankColumn function in a Record structure.
Rank kind Ordinal
This is the ranking that would calculate the ranking based on the condition you have determined, but then if there is a tie, it will give the higher rank to the record that is positional first in the original order of the rows in the table.
= Table.AddRankColumn(#"Changed Type","Rank",{"Sales",Order.Descending},[RankKind=RankKind.Ordinal])
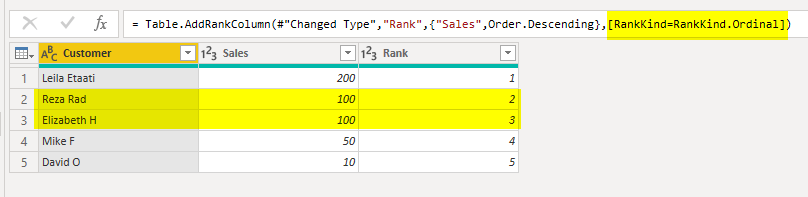
Using this kind of rank, you won’t have ties. This is useful when the original order of the table has a meaning and it is not just a random order.
Rank kind Competition
This is the default rank kind applied. This means if there is a tie, then items in the tie will have the same rank, and the items after that will have the rank starting after the collection of tie numbers.
= Table.AddRankColumn(#"Changed Type","Rank",{"Sales",Order.Descending},[RankKind=RankKind.Competition])
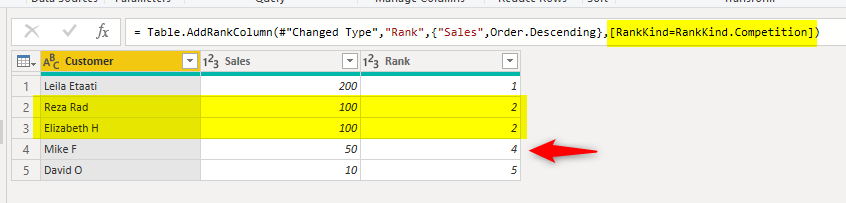
As you can see, there are two customers ranked 2, so the next customer “Mike F” starts with rank 4 instead of 3.
Rank kind Dense
This is similar to the Competition with the difference that the number after the ties just continues normally. In the example above, it would be 3 continuing not 4.
= Table.AddRankColumn(#"Changed Type","Rank",{"Sales",Order.Descending},[RankKind=RankKind.Dense])
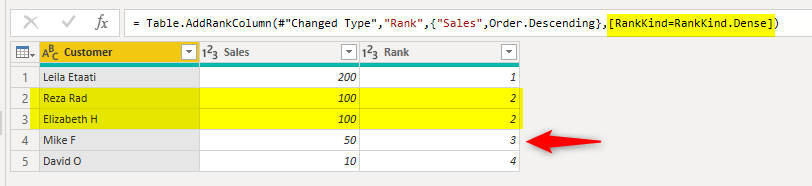
Both Competition and Dense rank kinds are showing the ties. Their difference is in what is the starting number after the tie.
Rank is different than the Index
In Power Query, you can add a row number to a table, which is called Index. The Index can start from zero, or one, or any custom number, and you can set the increment to whatever you want.
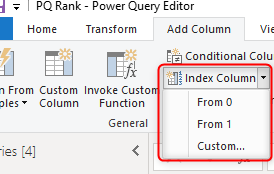
Adding the Index column is different from the Rank. An index is just a row number based on the current order of rows. This means you will need to order the rows before the index (using SORT). The index would never consider tie (meaning that it would be mostly like the rank kind ordinal in terms of the look). With the rank, you have the option to even set ranking on unsorted data and set the condition of the rank based on conditions on multiple columns, and choose what happens when there is a tie.
Summary
Ranking can be done in Power BI in multiple ways; dynamic, and static (or pre-calculated). If you want the ranking to be dynamic, then DAX measures are your friend. You can use functions such as RankX. However, if you are doing the ranking in a pre-aggregated table, then ranking using Power Query can be useful, which is what is explained in this article.
I provide training and consulting on Power BI to help you to become an expert. RADACAD team is helping many customers worldwide with their Power BI implementations through advisory, consulting, architecture design, DAX support and help, Power BI report review and help, and training of Power BI developers. If you need any help in these areas, please reach out to me.


Reza is author of more than 14 books on Microsoft Business Intelligence, most of these books are published under Power BI category. Among these are books such as Power BI DAX Simplified, Pro Power BI Architecture, Power BI from Rookie to Rock Star, Power Query books series, Row-Level Security in Power BI and etc.
He is an International Speaker in Microsoft Ignite, Microsoft Business Applications Summit, Data Insight Summit, PASS Summit, SQL Saturday and SQL user groups. And He is a Microsoft Certified Trainer.
Reza’s passion is to help you find the best data solution, he is Data enthusiast.
His articles on different aspects of technologies, especially on MS BI, can be found on his blog: https://radacad.com/blog.